I can think of stronger words: mutilation? defenestration? OK, OK. I was not injured let alone thrown out of a window.
This past week, for the first time, I tried to calibrate the system. What system? The one I brought here to observe and quantify polarized fluorescence on a confocal microscope. The heart of the system is a pair of liquid crystals that are used to manipulate the polarization state of the incident light. Because the liquid crystals affect beam based on the voltage applied, they can be programmed by software to affect the beam in more than one way. Starting with the inherent linear polarization of the microscope’s laser, the software part of the system programs the liquid crystals to rotate state of polarization from 0º to 135º, 90º, and 45º, acquiring an image at each state. With those four images, the system then calculates two more images: one showing the average orientation of the fluorescent molecules at each pixel and the second showing the net degree of alignment among the molecules at each pixel. Voila!
Because the confocal laser is not polarized perfectly, the liquid crystals need to be calibrated so that they can rotate the polarization of the beam as needed. That is what I mean here by calibration: Finding values to program the liquid crystals so that the beam will be rotated properly.
I attempted to do this rationally. Spoiler alert: that was a mistake. With a perfectly linearly polarized beam, the values in question for one of the liquid crystals would be 0.25, 0.5, 0.75, and 1. The other one would be 0.25. These are fractions of a wavelength (so quarter-wave, half-wave, three-quarter wave, and full wavelength).
I have a linear polarizer that is mounted on a dial with click-stops every 45º. I put this on the stage of the confocal, with the liquid crystals in their place. I turned the laser on and the transmitted light detector. That detector forms an image from the light that is transmitted through the sample; it is usually used to acquire a bright-field image of the sample, in contrast to the fluorescence from the sample which is collected by the objective lens. In this case, I am using that transmitted detector “image” to see how much light is getting through the rotatable filter.
I started off with the filter at its zero setting and rotated it in 45º steps looking at the average intensity reaching the transmitted light detector. I found the setting that gave the least light. This implies that the direction of polarization of the filter is more or less perpendicular the polarization direction of the laser. Then I tweaked the liquid crystal values for state zero to make the transmitted intensity as dark as possible. Then, I rotated by 45º and did the same for state 1. And similarly for states 2 and 3.
The numbers were rational; I felt smug. The setting for one of the liquid crystals stayed around 0.25 and the other one changed roughly by quarter wave steps. Score 1 for rationality.
Next I acquired images of celery xylem stained with Congo red. This sample has thick ribs of cellulose and so I have a good idea of what direction the cellulose is oriented. Later, when I looked at those images, my smugness was rotated by 180º. Anti-smugness. Dismay.
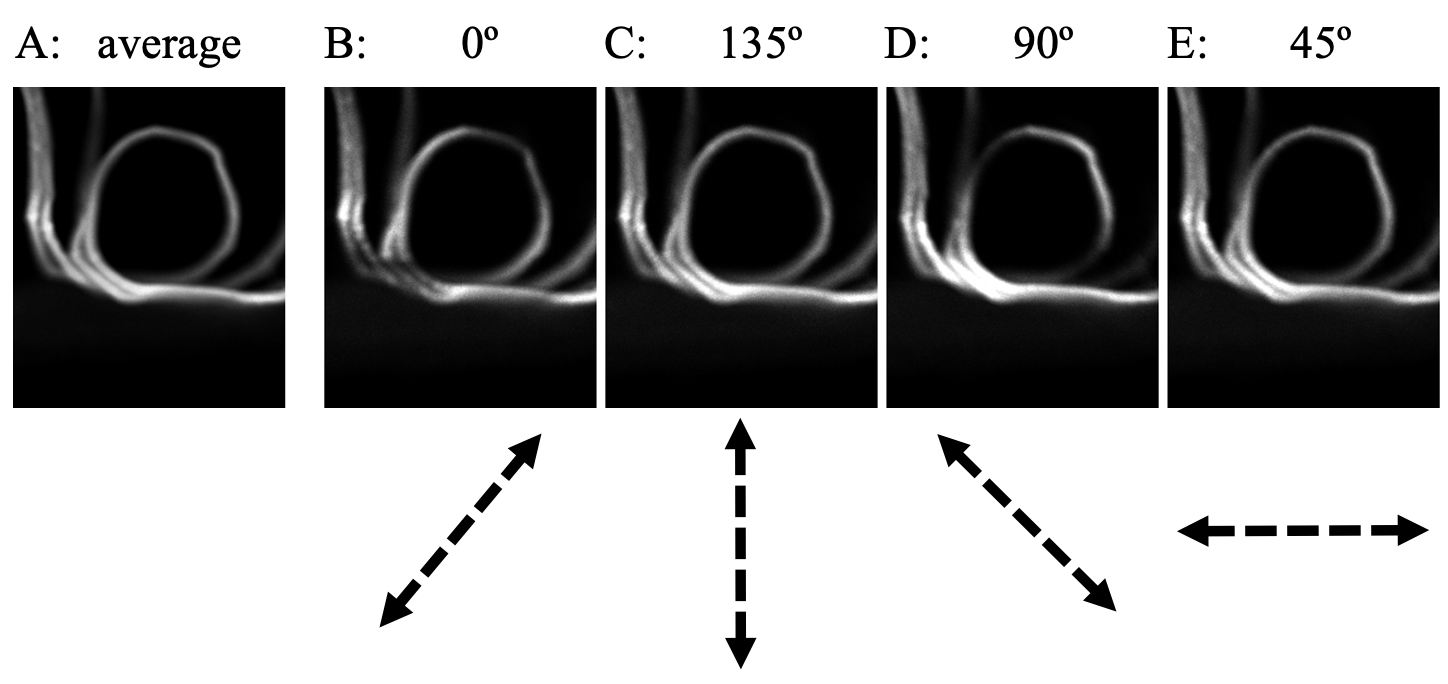
Figure 1. A band from celery xylem that was pulled open during dissection. Here it is viewed face on, forming a rough circle. In a well calibrated system, the regions of the circlar band that run perpendicular to the arrows below would be dim. They are for B and D but not for E and F. The dashed arrows below show putative states of linearl polarization of the exciting light.
The orientation calculated by the system for the xylem was way off. In one of the fields-of-view, a xylem band appeared in side view, forming a circle (Figure 1). To illustrate for you how poorly the system is performing, I made a composite showing average fluorescence and the fluorescence from each of the four liquid crystal states. In the figure, the possible (i.e., hoped for) status of linear polarization is shown by the double-headed dashed arrow below B – E. The cellulose will be oriented tangent to curvature of the ring (cellulose is a long fiber, there is really no way for it run other way than parallel to the ring). In Figure 1 B and D, the images look more or less ok: the fluorescence is dim along the arcs of the ring that are perpendicular to the arrow. But this is not the case for C and E. What’s more, in C and E, the straight bits running north-south (on the left) and east west (lower right) hardly change intensity. Calibration failure.
In troubleshooting, with help from Amit Verma, I took a look at a set of saved calibration files. These came with system files I brought with me, keeping all the files together in one place. I was not expected to use them because they are for a different microscope (and for various wavelengths). But in looking through them, I discovered that my supposedly rational expectation of well behaved calibration settings was wrong. The values for the states might as well have been random; I could see no hint of any pattern.
Probably, the explanation is because of the distortion of the polarization of the incident laser. I think this distortion makes it difficult (impossible?) to predict the settings of the liquid crystal needed to rotate the beam effectively.
My approach for next time will be to take one of the extant calibration files and build from it. I found one that has the same wavelength and magnification as I am using. And since the brand of microscope is the same between here and MBL (where the extant calibration file was made), this seems like a reasonable place to start. And I will choose any settings of the liquid crystals that give me the darkest field. No matter how they relate to each other. Let’s see what happens then!