Last week, I had three sessions on the confocal to work on calibration. My calibration went from steaming garbage to cold leftover pizza (Fig. 1). Better, but not yet appetizing.
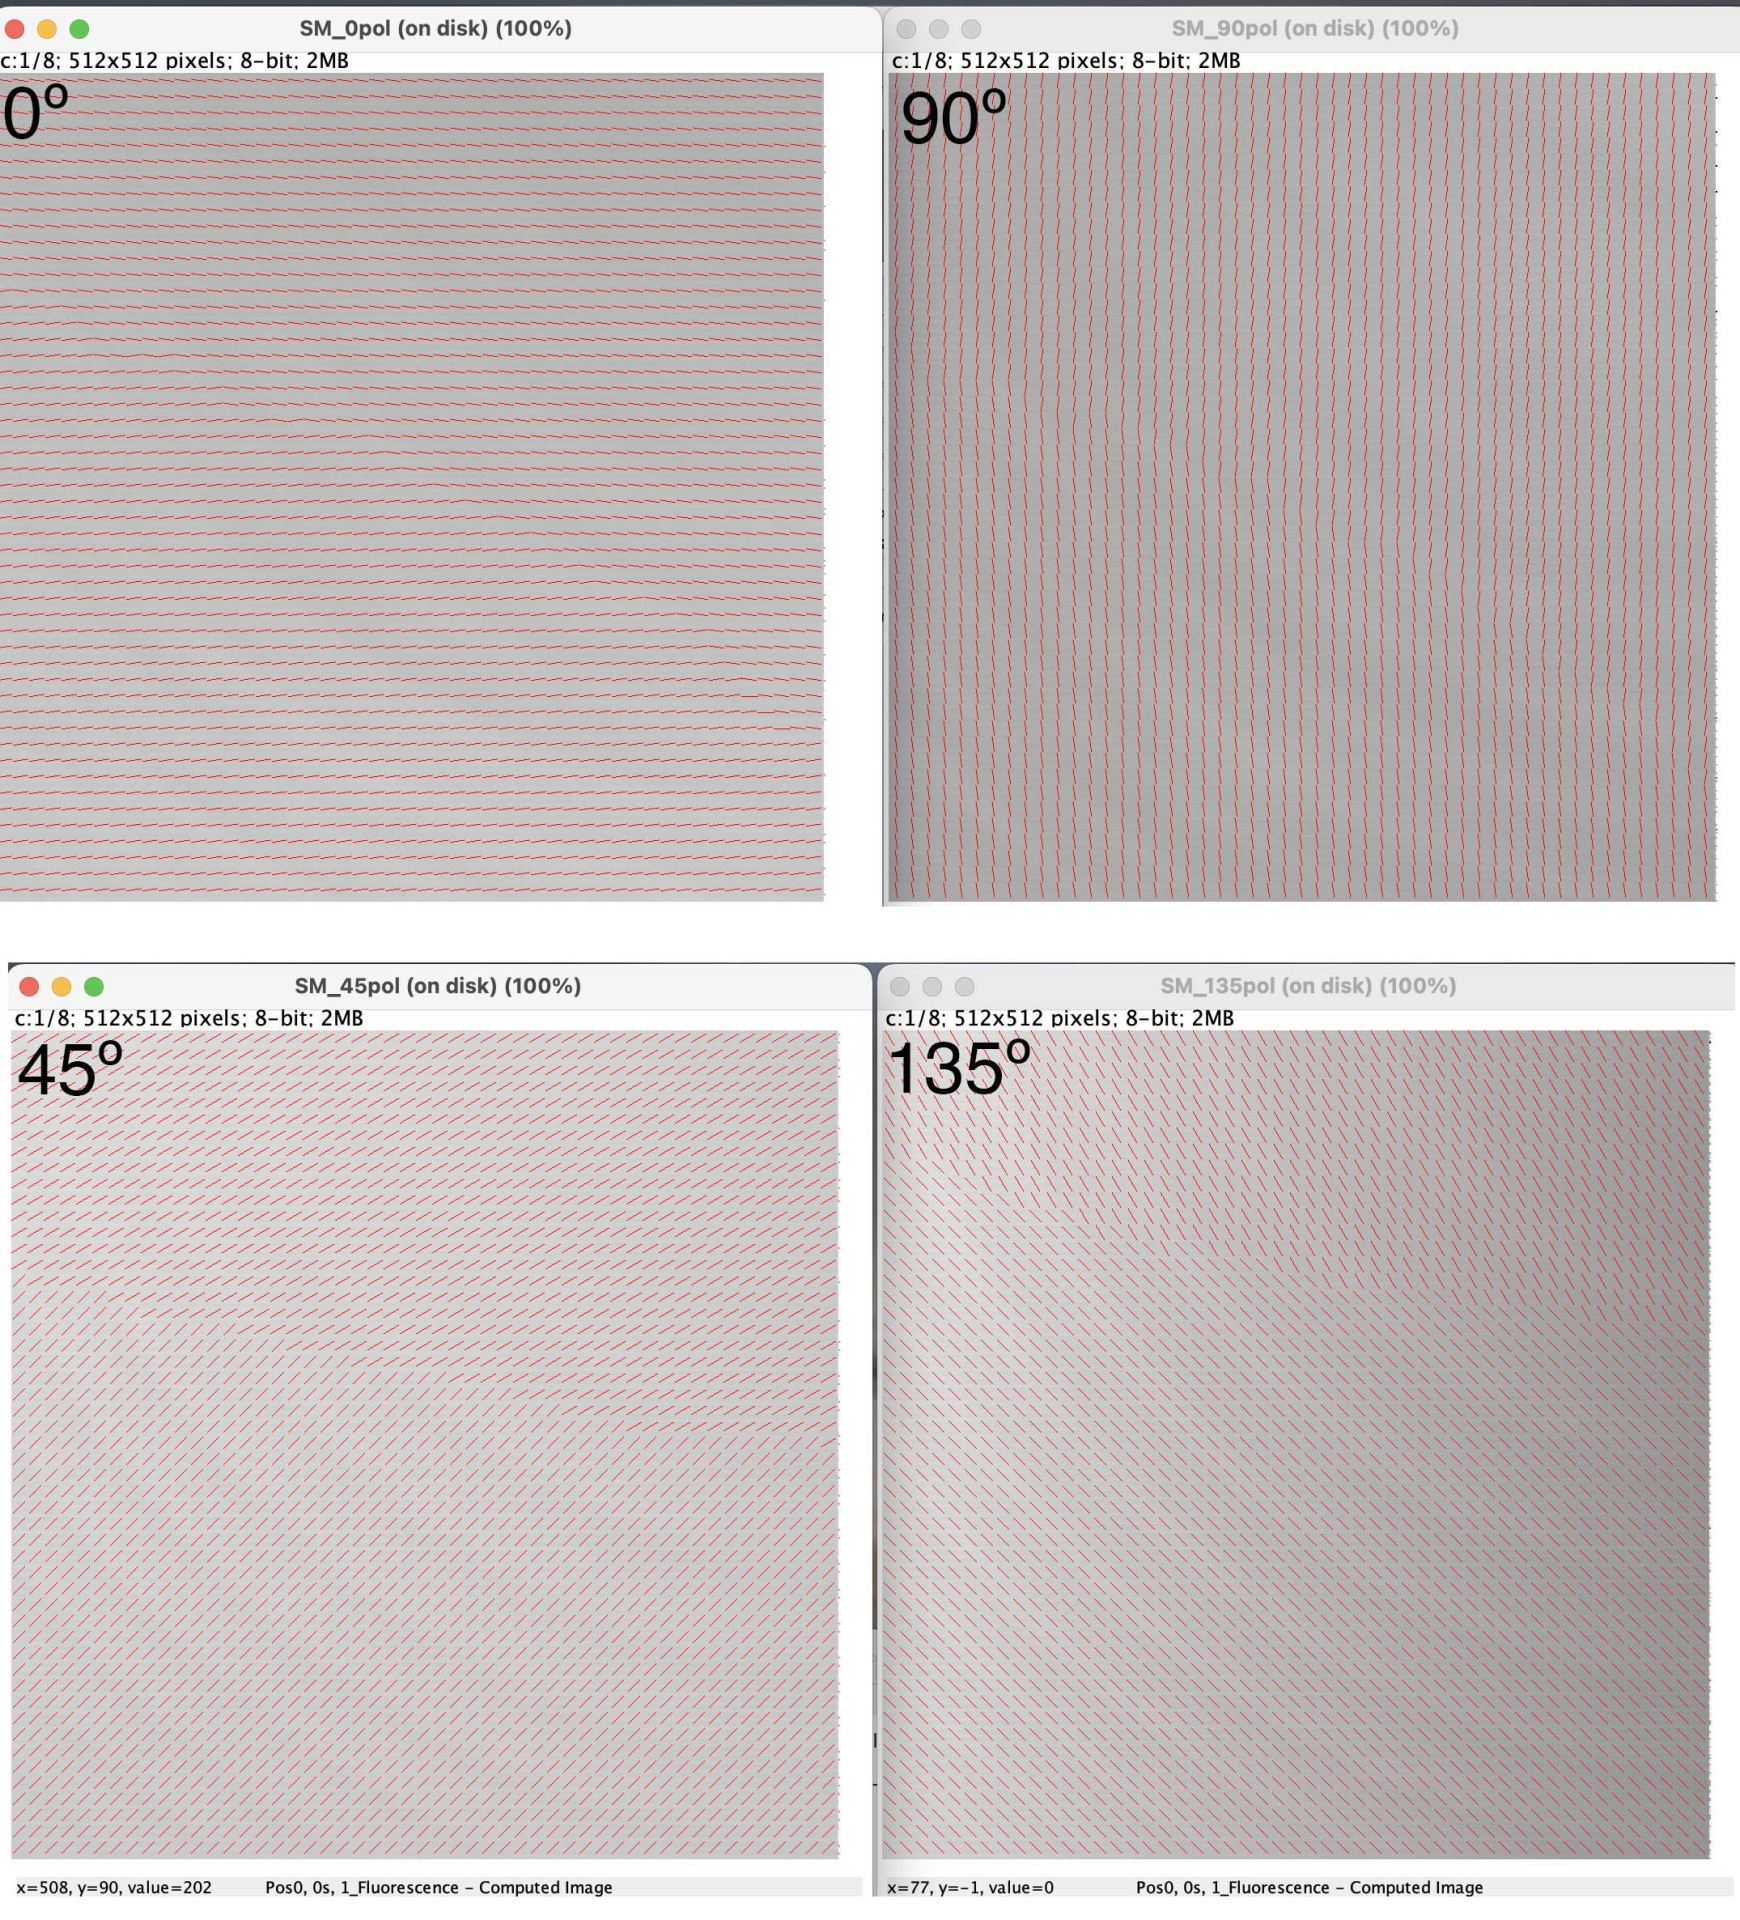
Figure 1. Results of the latest calibration. The “sample” is a linear polarizer whose transmission axis is as indicated in by the number in the upper left (with horizontal = 0º and angles increasing counterclockwise). The red lines show the direction of the transmission axis as calculated by the optical system. The top two look decent, the bottom two not so much. Calibration continues!
What you are looking at in Figure 1 is the field of view that the microscope camera1 and I see during calibration. As I explained last post, I put a rotatable linear polarizer on the stage of the microscope. The light from the laser passes thru the liquid crystals, then on to the objective lens, the rotatable polarizer, the condenser, and finally reaches the camera (footnote 1, again). This is not an image in the traditional sense; no lens was focused on a sample. But it is nevertheless an image because that is what is shown on-screen by the optical system.
Calibration involves changing the values that specify the status of the liquid crystals until the overall intensity of this field of view is minimized; this needs to be done for each of four settings of the rotatable polarizer (0, 45, 90, and 135º). When I calibrate, the camera output is shown live on the computer screen. I see a more or less featureless field of view (as in figure 1, but without the red lines). After finishing the calibration, I check: I pretend that the rotatable polarizer is a fluorescent sample. I dial it to the first position, zero degrees say, and then collect the four images with the four (hopefully calibrated!) settings of the liquid crystals. From these four images, the software calculates two more images: one showing the orientation of the aligned elements and the other showing their degree of alignment2. Then, to visualize the orientation, the software can overlay short red lines, whose angle equals the calculated orientation. And that is what you are seeing in Figure 1.
In Figure 1, the upper two images show results for the rotatable linear polarizer set to zero (left) and 90º (right). In the lefthand image, the red lines run left to right, as expected for zero degrees; in the righthand image they run up and down, again as expected. Measuring the average intensity (on a scale where black = 0º and white = 180º), I get 90 ± 4º and 89 ± 4º (mean ± standard deviation). That seems good. The lower two images show results for the rotatable polarizer set to 45º (left) and 135º (right). The bottom half (or more) of the images look pretty good, with the average intensity measuring 43 ± 2.3º and 136 ± 2.4º. But the top half of those images are non-conforming to a worrying extent.
I also took more xylem images and they are looking better. I need to take more images to evaluate the performance more carefully.
As for calibration, I have identified issues of concern. As follows.
Is the liquid crystal unit damaged? The unit has been used in confocal microscopy where it gets slammed by a laser. The unit is about a decade old. I am going to power it up and inspect it directly to look for any unevenness in the field of view.
Should I calibrate by working with only the central region of the field of view? Perhaps finding the right settings is hindered by distortions around the edges of the field? Working with only a central region of interest is straightforward; I will try (vive le ROI!)3.
Finally, the lens on the confocal microscope is a water immersion lens but I have been calibrating in air. Furthermore, the rotatable polarizer stands up off of the stage, rather far from where the sample will (eventually) be. I have a square piece of linear polarizing film. I think by means of the slide holder, I can have this fixed at the required angles (0, 45, 90, and 135º) and immersed onto the objective. I am also going to try. See if the results are any better.
Step by step to delicious calibration. Either that or starvation!
- Strictly speaking, the microscope is using a photomultiplier not a camera. The confocal scans the laser across the sample and the photomultiplier records the intensity level at each point in the scan and builds the image, pixel by pixel. But for understanding what the figure shows, this difference is not material. ↩︎
- Obviously, the rotatable linear polarizer is not fluorescent. What I am doing in fact is assaying linear dichroism: namely, absorption as a function of orientation. But it turns out calculating dichroism and fluorescence anisotropy use the same math. ↩︎
- In image analysis, a region of interest is widely abbreviated as “ROI”. Sorry! ↩︎