I am fretful. Forgetful too, but that is a story for elsewhere. Last week, my efforts to find out what is going wrong have shown me things look very wrong. I don’t know why; I am unsure what to do next. I have appealed to my expert colleagues, Rudolf Oldenbourg and Amit Verma of Marine Biological Lab. In the meantime, the decks heaving and I am trying not to do the same.
Let’s look at some pictures. To see if the angle error I reported last time arises from hidden structure of the sample or misbehaving equipment, I rotated the sample between images. To be able do this, I had to make a new celery xylem preparation. The preps I made up to now are all on glass slides, standard operating procedure for microscopy. However, the particular microscope I am using hinders rotating a standard-issue microscope slide. And by “hinders” I mean prevents it utterly. Instead, I made the prep a “MatTek” dish (Fig. 1). These little plastic dishes are 35 mm in diameter and have a hole drilled through the bottom, over which a coverslip is glued. Being careful not to snap the coverslip, I dissected out the stained xylem stands and let them dry down on the coverslip. Then added a large dollop of immersion oil as a surrounding “mounting” medium and a coverslip on top. The point being that I can rotate the little round dish while it sits snugly on the microscope stage.

Figure 1. MatTek dish. Picture of the dish from a catalog (left). Diagram of how the dish is used on an inverted type microscope to allow the coverslip to be next to the objective but without having to turn a standard microscope slide upside down. Like Kleenex, MatTek is a brand name for the company that sold them first or perhaps most successfully.
And rotate the dish I did. Six times. The results tend to exonerate the sample, pointing instead to the hardware or software (Fig. 2). The column on the left shows the total fluorescence. I stained the xylem with fast scarlet, which binds cellulose. The ribs are bright against a dark background. Each row in the figure represents a different rotation position (numbered 1 through 6). The rotation is clear from the fluorescence image. By chance, there was a bright dot on one of the ribs (the rightmost rib in position 1); this helped make sure that I had the same stretch of xylem (more or less) in the middle of the field of view after each rotation (this particular xylem stand was not at the center of rotation so a bit of up/down, left/right repositioning was required after each rotation).

Figure 2. Measurements depend on the orientation of the sample. A celery xylem strand stained with fast scarlet and imaged on the LSM780 confocal equipped with OpenPolScope. I obtained images with the strand positioned at six orientations (rows 1 – 6). Average fluorescence (left column); orientation (center); and anisotropy (right).
The middle column shows the orientation image. I showed this kind of image in an earlier post. Based on the raw input images, the software calculates an angle for each pixel: the angle being the apparent orientation of the fluorescent molecule (strictly speaking, the orientation of its emission dipole). An angle of 0º results in a pixel with a gray level of zero (full black) while an angle of 179º results in a pixel with a gray level of 255 (full white). In other words, the brightness of the pixel corresponds to the angle that the system calculates at that pixel. Without even measuring, you can see how the ribs change brightness on each row; thus, the angle calculated by the system is sensitive to the orientation of the structure on the stage.
The other parameter calculated by the software is called ‘anisotropy’ (righthand column in Fig. 2). This parameter represents the degree of alignment among the fluorescent molecules. A value of one means perfect alignment and a value of zero means no co-alignment whatsoever. Here too, the brightness changes as a function of the rotation position.
As an aside, note that in both the orientation and anisotropy images, the ribs appear longer and wider than they do in the fluorescent images. I think this is because the software actually calculates these quantities (orientation, anisotropy) on the basis of neighborhoods, not single pixels. If so, then this is expected and unlikely to be the source of the problem. I am checking with Amit, who wrote the code.
And to drive the point home, here are the graphs (Fig’s 3 & 4). The angles stray from the dotted line (1:1) and seem to plateau (??). The range of anisotropy spans almost the full range of possible values. From previous work, I expect an anisotropy of around 0.3. If so, then rotation positions where the anisotropy is about right are those where the angle is worst; and vice versa.

Figure 3. Calculated angle vs reference angle for six ribs shown in Fig. 2. Dotted line represents 1:1 correspondence. I measured the reference angle on the fluorescence image and drew a small region-of-interest over the rib on that image; then, I measured the average gray level within that region on the orientation image. Because the values for each rib were similar, I averaged the data for the six ribs. The standard deviation in the calculated angle is shown when larger than the symbol.
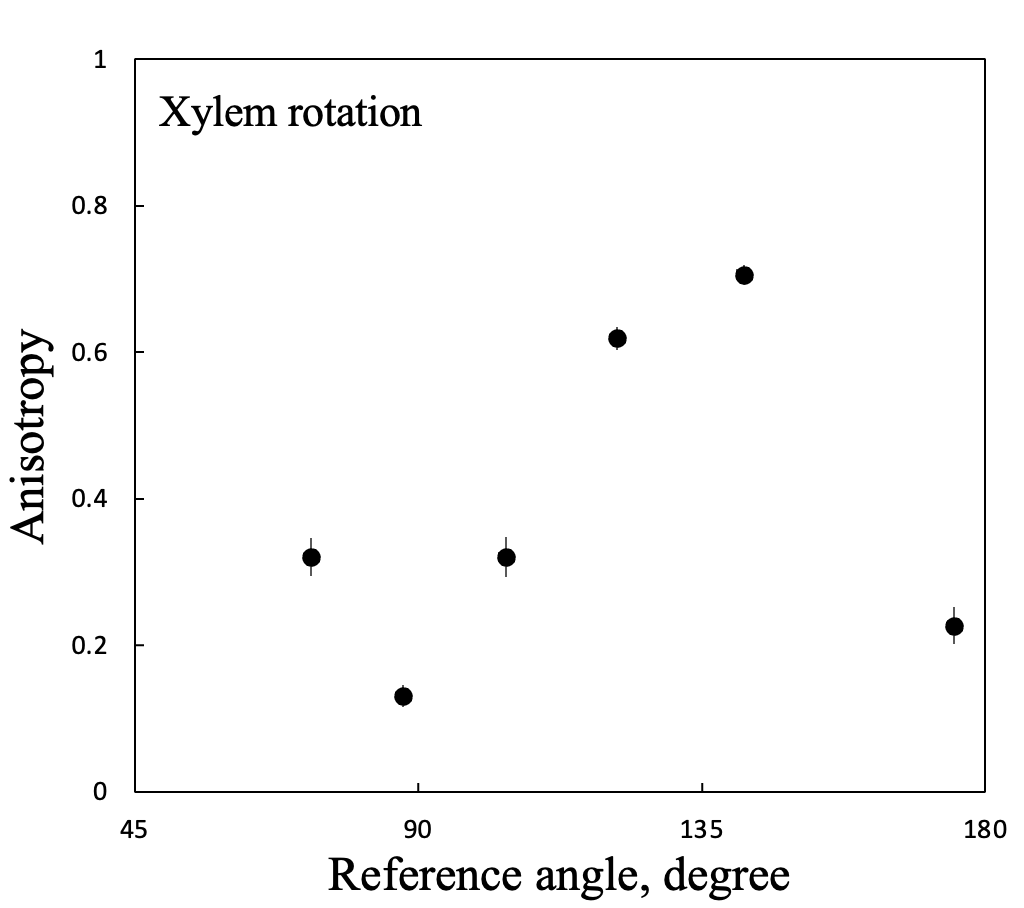
Figure 4. Calculated anisotropy vs reference angle for six ribs shown in Fig. 2. For measurement details, see the legend for Fig. 3.
I am fretful because of the large size of these errors. I did not correct for the background, each position undoubtedly differed slightly in focal plane, and my calibration probably needs turning. From what I have seen before, these have modest impact. Perhaps (probably?) I did something disastrously stupid while collecting these images? That’s a possibility I would not bet against. This week I will go over everything carefully and hope for an aha moment!
Are you the same Tobias I know from Treasure Beach, Jamaica or have you morphed into someone totally else?
Hi Joshua, Sorry, nope. I have never been to Jamaica, let alone Treasure Beach. No morphin’ just never me. Another Tobias
Hi Tobias,
Interesting post as awlays!
The complementary relationship of the orientation and anistropy images is very striking… it’s almost as if the orientation image is flat where the anisotropy isn’t, and vice versa. It reminds me of AFM images in which the desired features are either visible in the height or error channel, depending on how well-tuned the feedback is. It’s definitely not the same but potentially meaningful – how is anisotropy calculated?
Perhaps one of the polarization angles used to build up the image series is in some way faulty? This could conceivably affect the calculations in a manner dependent on the angle of the sample to the faulty image, though it depends on the specifics…
Thanks Nat! Yes, I agree. I have been itching to tune the calibration, see how much difference that makes. The histogram function on the confocal launches an obsolete windows updater (!!!) and crashes the system. I need to see the intensity values to calibrate and so without the histogram function, no calibraiton possible. Should be fixed soon…
That must be frustrating, despite how funny it sounds…
The humor is a silver lining. Ok maybe not silver, how about tin? Antimony? Pewter?