SocialSci

There’s this website I came across while investigating what other people are doing for online experiments. It’s called SocialSci.com. They have a platform for writing experimental surveys. They also boast of a well-curated participant pool. Here’s the claim on their front page:

We take a three-tiered approach to our participant pool. We first authenticate users to make sure they are human and not creating multiple accounts. We then send them through our vetting process, which ensures that our participants are honest by tracking every demographic question they answer across studies. If a participant claims to be 18-years-old one week and 55-years-old the next, our platform will notify you and deliver another quality participant free-of-charge. Finally, we compensate participants via a secure online transaction where personally identifiable information is never revealed.

Ummmmm, okay. That’s not game-able at all.

If you were thinking about just using their survey design tools and instead posting your instrument on AMT, be warned! They point out that AMT is full of scammers! I’m not sure this is true anymore; my own research has lead me to believe that traditional survey issues such as fatigue and attention issues are a bigger threat to validity. In any case, I looked up quotes for using their participant pool. The costs for 150 respondents (assured to be valid, via some common sense heuristics and their more complete knowledge of the participant pool) and no restrictions on the demographics (e.g. can include non-native English speakers) are:

My estimated time (in minutes)Price (in USD)
5300
10300
15300
20300
25300
45300
55450
60450

Even with bad actors, I’m pretty sure AMT is cheaper. The results were the same when I submitted a request for country of origin==USA. There were also options for UK and Australia, but these are not yet available (buttons disabled). I’ll leave any analysis of the pay to Sara.

Their filters include Country, Language, Age, Sex, Gender, Sexual Orientation, Relationship Status, Ethnicity, Income, Employment Status, Education, Occupation, Lifestyle, and Ailments. What I find potentially useful for survey writers here is the opportunity to target low-frequency groups. There’s our now infamous NPR story on how teens respond mischievously to survey questions. The set of responses from these teens have a high number of low-frequency responses, which amplifies false correlations when researchers analyze low-frequency populations. A service like SocialSci could provide useful, curated pools that rely less on one-time self reporting. However, it doesn’t look like they’re there yet, since there are the options available (shown, but currently disabled options are listed in brackets):

Country: USA, [UK], [Australia]
Language: English, [Spanish]
Age: 13-17, 18-40, 41-59, [51+], [60+]
Sex: Male, Female, [Transgender], [Intersex]
Gender: Cis Male, Cis Female, [Trans Male], [Trans Female]
Sexual Orientation: Heterosexual, Homosexual, BiSexual (sic), Other
Relationship Status: Married, Single, Co-Habitating, Dating
Ethnicity: Caucasian, [Asian], [Hispanic], [Black], [Native American], [Multiracial]
Income: less than 25K, 25K-50K, 50K-75K, 75K-100K, [100K-125K], [125K or more]
Employment Status: Full Time, Unemployed, [Part Time], [Temporary Employee Or Independent Contractor]
Education: Some College, Associate’s Degree, High School Diploma, Bachelors Degree, Some High School, [Masters Degree], [Doctoral Degree]
Occupation: Student, Professional, Technical, Teacher, Sales, Corporate
Lifestyle: Smoke, Used to Smoke, Have Children, Have Cell Phone
Ailments: Chronic Pain, Addiction (Smoking)

** sorry for the lack of formatting!! Also, what do you think of these demographic characteristics? Please leave comments!**

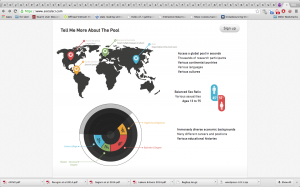
I want to note that the front page advertises “a global pool.” In keeping with the spirit of the times, I’ve included a screenshot (things I’ve learned from shaming bigoted celebrities who express themselves a little too freely on twitter!)

Screen Shot 2014-07-31 at 7.04.57 PM

Now, it’s quite possible that they have at least one person from every demographic listed, but not 150. Until they can compete with AMT in size (where 150 respondents ain’t nothin), I think they should be careful about what they advertise to researchers.

It’s not clear to me how SocialSci recruits their participants. Here’s the page. I had never heard of them until I went looking for resources used in other experiments (via this page Emery recommended) I just did a search of craigslist to see if there’s anything there. No dice. $10 says it’s just their team plus friends:

[youtube]https://www.youtube.com/watch?v=N9qYF9DZPdw[/youtube]

Snark aside, I’d like to see what a well-curated pool looks like. Not sure these folks are up to the task, but just in case, I did them a solid and posted their signup page on craigslist. I’m not holding out on it being as effective as the Colbert bump, but a girl can dream.
Reproducibility and Privacy

What would it take to have an open database for various scientific experiments? An increasing number of researchers are posting data online, and many are willing to (and required) to share their data if you ask for it. This is fine for a single experiment, but what if you’d like to reuse data from two different studies?

There is a core group of AMT respondents who are very active. Sometimes, AMT respondent contact requesters, at which point they are no longer anonymous. My colleague, Dan Barowy received an email from a respondent, thanking him for the quality of the HIT. I asked him the respondents name and as it turned out, they had contacted me when I was running my experiments as well.

So if we have the general case of trying to pair similar pieces of data into a unit (i.e. person) and the specific case of AMT workers who are definitely the same people (they have unique identifiers), how can we combine this information in a way that’s meaningful? In the case of the AMT workers, we will need to obfuscate some information for the sake of privacy. For other sources of data, could we take specific data, infer something about the population, and build a statistical “profile” of that population to use as input to another test? Clearly we can use standard techniques to learn summary information about a population, but could we take pieces of data and unify them into a single entity and say with high probability these measurements are within some epsilon of a “true” respondent? How would we use the uncertainty inherent in this unification to ensure privacy?

Is it possible to unify data in such a way that an experimenter could execute a query asking for samples of some observation, and get a statistically valid Frankenstein version of that sample? I’m sure there’s literature out there on this. Might be worth checking into…

On Experiments vs Surveys (Ramble Time!)

“Big data hubris” is the often implicit assumption that big data are a substitute for, rather than a supplement to, traditional data collection and analysis.

The core challenge is that most big data that have received popular attention are not the output of instruments designed to produce valid and reliable data amenable for scientific analysis.
Lazer et al.

I wrote previously about the range of experimental paradigms available to us on the web. In that post, we looked at observational studies, surveys, quasi-experiments, and experiments on axes that captured the range of control available to us. We might to consider other axes as well:

Exploratory vs. Confirmatory

Observational studies and surveys can be considered more exploratory, whereas quasi- and true experiments are more confirmatory. This follows from the level of control we expect to have. Observational studies, as we’ve said before, are a lot like data mining. The environment that we are observing is rich with potential features, but may also be sparse with respect to observations on those features. Suppose we were interested in improving a recommendation system. We might start by looking for correlations between products. That is, we might observe that people who watched The Wizard of Oz also watched It’s a Wonderful Life on Netflix, or people who bought Bishop’s Machine Learning book also bought Hastie et al’s Elements of Statistical Learning on Amazon. We would quickly find that while there are a few strongly correlations, we would have a long tail of single observations. Furthermore, our observations do not differentiate between a lack of information and negative training data. That is, we do not know if someone hasn’t watched 2 Fast 2 Furious because they didn’t know it existed or if they didn’t watch it because they already know they won’t like it. Many of these recommender systems have user-provided ratings to help differentiate these two categories, but they cannot cover all the cases, since ratings are still opt-in.

While I am personally not particularly interested in recommender systems, they do provide a nice example of how different instruments correspond to exploratory vs. confirmatory data analysis. We could start by extracting interesting features from our user and product base. By “interesting” we mean features that have sufficient observations, that are as close to orthogonal as possible. The researcher should use domain knowledge to enumerate features.

Slight tangent: One thing I want to point out at this point is that enumerating features is the first step in generating a hypothesis we might want to test. In a lot of ways, features are the source of the hypotheses we’re testing. Features are the basic building blocks of hypotheses. Emery and I discussed recently the idea that hypotheses are like a probabilistic grammar over these features. Typically in machine learning research, the model is the subject of interest. The model is a representation of the variables of interest. What is the relationship between the features and the variables? Features are either directly observed or computed from the data. Personally, I would say that “computed from the data” here should have kind of bound on it. Clearly in the case of text classification, surface string suffixes are valid features. But what about parts of speech? If you are performing co-reference resolution or doing some kind of entity identification, then parts of speech could be a useful feature. But what if your task *is* part of speech tagging? Would it be fair to use the tags from one part of speech tagger as input to another? What if you did a first pass with your tagger, and then used that information as input on another run (that is, your tagger can take its own output as input)? Now what are the differences between variables in your model and features? /endrant

We would begin our exploratory analyses by looking at the features and the raw data and seeing what we find there. We can use this information or our own domain knowledge to construct a survey. The purpose of this survey is to collect data we might not otherwise have access to. For example, we might explicitly ask respondents who use Netflix about their viewing preferences. As discussed in my earlier post, this helps us fill in some data we might not have already.

A difference we generally see between traditional surveys and what we’ll call experimental questionnaires is the presence of a hypothesis to test. We’ll get into this in a later blog post, but generally in surveys we do not have the notion of a null hypothesis, nor an experimental control. I would say that surveys have their origins in much more qualitative goals. While they are used to guide decision-making, they are also widely used to help tell a narrative. This isn’t to say that they can’t or aren’t being used They can be manipulated easily, if they are not designed well, and it can be difficult to differentiate between well-designed surveys and poorly designed surveys. This susceptibility to manipulation strongly motivated our work on SurveyMan.

We noticed that there were considerable differences in the objectives and designs of the surveys our collaborators were using. For example, our collaborators in linguistics used surveys in a more experimental context — the questions in their surveys bore strong similarity to each other and their differences could be subtle to detect. Many of the questions belonged to discrete categories (what we might call “factors” in experimental design). There wasn’t much variability between questions. Those surveys were very focused on acquiring enough information to answer a particular question, or test a particular hypotheses.

The wage survey we ran was quite different. The questions were structurally heterogenous. None of the questions were “redundant” (that is, they did not appear to represent categories of questions that are equivalent in some way). The nature of survey design will always inject some bias for generating hypotheses — for example, the wage survey did not ask questions about favorite foods or whether the respondents had a family history of breast cancer. The authors of the wage survey were clearly interested in the relationships between education, employment, attitudes toward the AMT marketplace, and willingness to negotiate wages. However, the survey was not encoded as an experiment. It was more exploratory. We observed some interesting behavior in the context of randomization and breakoff, and would like to use this information in a future study.

Missing Data

In a survey, if we have missing data, it’s due to breakoff. We are faced with some choices: if breakoff occurs more frequently at a particular question, we ought to look at the question and see what’s going on — is it worded poorly? Are there insufficient options to cover potential responses? Is the question potentially offensive? If breakoff occurs most frequently at a position, this might indicate that the survey is too long, or that there’s a jarring shift between blocks in the survey. We would generally use this information to help debug the survey.

In an experiment, it’s not quite clear that the researcher would use the same information in the same way. Since we expect experiments to have some redundancy built in, breakoff at a particular question might tell us less than breakoff at a question type. That is, we might suspect there to be a latent variable influencing breakoff. Our analysis will have more hypotheses to consider when diagnosing the cause of breakoff.

Confounding variables

A major threat to validity in experiments that is not typically addressed (so far as I can tell) is the failure to model confounding variables. This is where we might use surveys, or a survey-like section of an experiment, to help identify these variables. We’ve done this sort of thing before — in the linguistics surveys, we had a demographics section. We could expand this and ask more questions in an attempt to capture these other variables. In any case, there is something qualitatively different about the demographic questions, when compared with the core questions of interest. In both surveys and experiments, we can view demographic questions as a path to stratifying the population. However, there seems to me to be a clearer divide between how these questions are used in surveys versus experiments.

Correlation vs. Causation

With surveys, we are looking primarily for two things: the raw data (e.g. 35% of Netflix subscribers have viewed The Wizard of Oz) and correlations (viewing It’s a Wonderful Life is positively correlated with having viewed The Wizard of Oz more than once). In experiments, we are also interested in the raw data and correlations, but we are also looking for causal relationships and patterns in the latent variables. If we are lucky, we might be able to find causal relationships in a dataset, but the permutations required to infer a causal relationship may be too spare for us to discover them through data analysis alone. Instead, we will need to design experiments to ensure coverage of the space. This will require some changes to the specification of the survey language, to capture the abstractions we need.