
The Arctic water cycle in intimately linked with carbon and energy cycles. Climatic warming and human influences are altering the magnitude and timing of hydrological storages and fluxes, and there is a risk that the system may transition from a surface to more groundwater-dominated regime. The Pan-Arctic Water Balance Model (schematic below) simulates all major elements of the arctic water cycle and has been applied in several recent studies. Detailed descriptions can be found in Rawlins et al. (2003), Rawlins et al. (2013), and Rawlins et al. (2019)
Rawlins, M. A., D. J. Nicolsky, K. C. McDonald, V. E. Romanovsky, 2013: Simulating soil freeze/thaw dynamics with an improved pan-Arctic water balance model, Journal of Advances in Modeling Earth Systems, 5, 1-17, doi:10.1002/jame.20045
Rawlins, M. A, R. B. Lammers, S. Frolking, B. Fekete, C. J. Vorosmarty, 2003: Simulating Pan-Arctic Runoff with a Macro-Scale Terrestrial Water Balance Model, Hydrological Processes 17, 2521-2539

Characteristics of the PWBM soil submodel. Winter hydrology is controlled by seasonal accumulation of precipitation as snow and mass losses through sublimation. In permafrost regions an active layer develops in spring. The model accounts for water gains through infiltration and losses from runoff and evapotranspiration (ET). It includes a surface pool, with storage increasing when runoff exceeds infiltration capacity and decreasing through lateral runoff. ET occurs from each soil layer within the rooting zone. The soils column transition to frozen conditions during autumn. The model simulates a dynamic water table, with drainage between layers following Darcy’s Law as solved through the Richard’s equation.
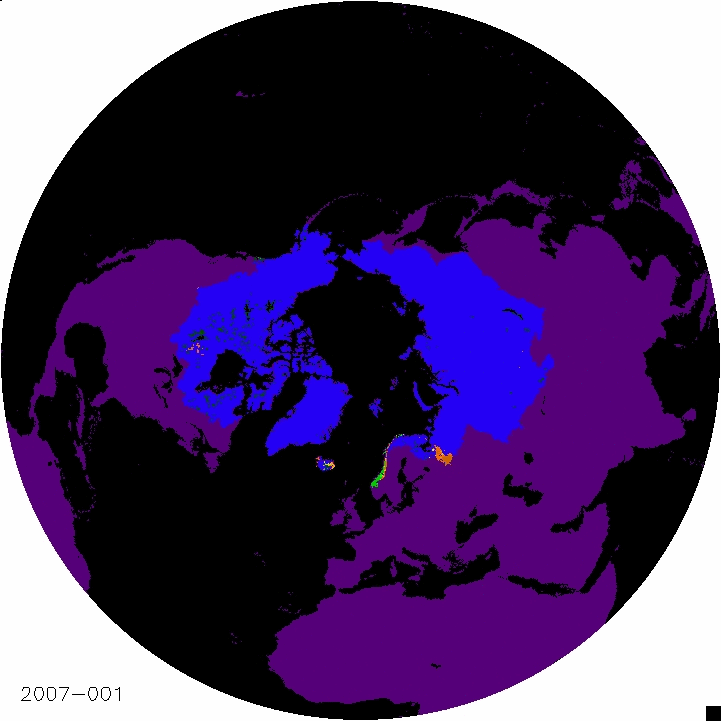
Soil Moisture Across the Pan-Arctic Basin
This animation of soil moisture variations shows daily changes in moisture content of the uppermst soil layers from frozen in winter (blue) to thawed in the warm season. The area in blue represents all areas which drain to the Arctic Ocean. Volumetric water content is shown in shades from brown (driest) to green (wettest). Note how weather systems moving from west to east wet the soil, which then dries due to evaporation from the soil and transpiration from vegetation. Note also how the thaw starts in the south and then progresses northward. The shortest thawed season is in northern Siberia.
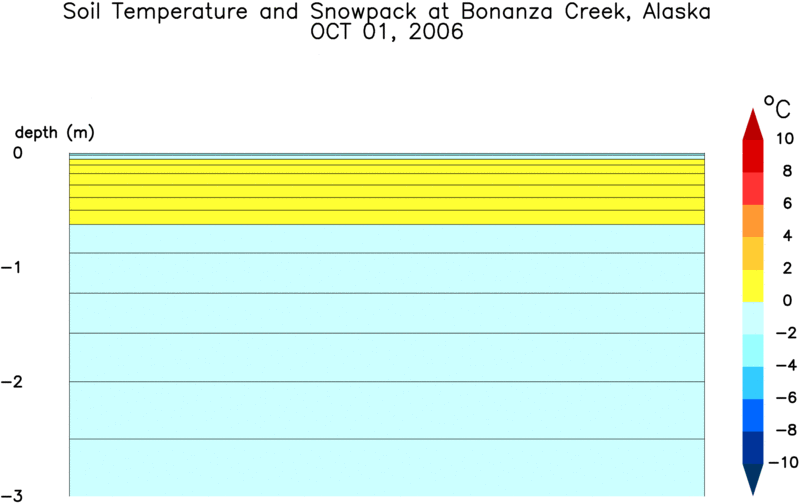
Soil Temperature
This animation shows changes in soil freeze and thaw for one grid cell encompassing Bonanza Creek, Alaska. While the model simulates dynamics through deeper soil, this animation depicts only the upper 3 meters, where the largest seasonal changes occur. It shows daily temperatures in the soil layers through the year as well as the accumulation and melt of the snowpack. The snowpack changes color from light to dark pink as it melts in late spring. A small ponded surface also develops in the simulations if conditions are right, shown as a blue rectangle above the soil surface.
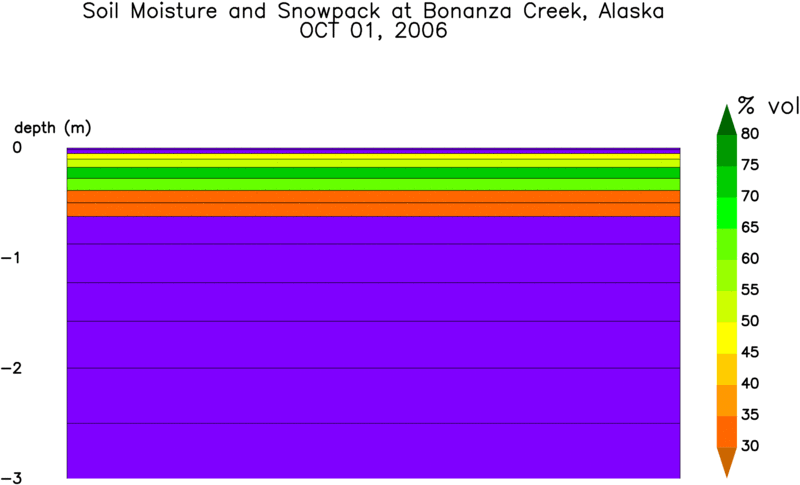
Soil Moisture
Rather than soil temperature, this animation shows daily changes in soil moisture. Colors indicate the volumetric water content of the soil layers. Frozen layers are shown in purple. Snow accumulation is shown in shades of pink, with variations based on snowpack liquid water content. Note how the upper layers, often composed of more porous organic-rich material, have a relatively high moisture content soon after snow melt. Soils dry throughout summer through vegetation transpiration and surface evaporation.
Cycling of Carbon in Arctic Ecosystems
High northern latitude land areas are a large sink of atmospheric carbon dioxide (CO2). Warming and disturbances such as fire, insects, and human activities influence the sinks and sources of CO2. Recent research suggests that in coming decades Arctic ecosystems may change from a carbon sink to a source. Results shown are from a study of the land-atmosphere exchange of CO2 using a set of earth system models. This research represents one element of a NASA funded project focused on understanding the carbon cycle of northern Eurasia through a synthesis of data and models.

Long-term average annual Net Ecosystem Productivity (NEP) as a multimodel average across northern Eurasia.
NEP is the CO2 exchange between the land and atmosphere, estimated as the difference between gross primary production and ecosystem respiration. Areas in blue are a net source of CO2 to the atmosphere. The net sink across tundra areas is fairly small (2-4 grams of carbon per square meter each year).

Annual NEP as an average across nine earth system models over the period 1960-2009. The increasing net sink shows signs of weakening.
From Rawlins et al. (2015)
Climate Change and Associated Impacts Across the Northeast US
The Northeast US is home to over 55 million people. Changes connected to a warming climate include increases in precipitation, more extreme heat events, and rising sea levels. Our understanding of potential changes in air temperature and precipitation across the region and at sub-annual time scales has been advanced with the development and application of high resolution Regional Climate Models (RCMs). Projections of mid-century changes in seasonal air temperature and precipitation from a suite of RCMs forced with the SRES A2 scenario for greenhouse gas emissions suggest warming of 2-4 C and very likely wetter winters.

CAPTION: Change (oC, 2041-2070 minus 1971-2000) in seasonal temperature from the ensemble mean of the nine model pairs from the North American Regional Climate Change Assessment Program (NARCCAP). Significance determined following criteria described by Tebaldi et al. (2011). Changes are significant at the 95% level for all grids (shown stippled) across the Northeast. Details on meaning behind the uncertainty and significance logic are found in Rawlins et al. (2012).

CAPTION: Relative percent change (2041–2070) minus (1971-2000) in seasonal precipitation from the ensemble mean of the nine model pairs. Units are percent of present-day precipitation. Areas in white represent a disagreement in the sign of change.
Rawlins, M. A., R. S. Bradley, H. F. Diaz, 2012: Assessment of regional climate model simulation estimates over the northeast United States, Journal of Geophysical Research, 117, D23112, https://doi.org/10.1029/2012JD018137
Tebaldi, C., J. M. Arblaster, and R. Knutti, 2011: Mapping model agreement on future climate projections, Geophys. Res. Lett., 38 L23701, https://doi.org/10.1029/2011GL049863