Over Christmastime 2025, my dad and I decided to write down some of the information on our ancestors that he had collected and also what we could find on the internet (which turned out to be a lot). He had the good idea of putting it into a spreadsheet. This post is a guide to how the spreadsheet is structured, and also a summary of some of its contents. A caveat right away: this information mostly hasn’t been verified against original records. But I’ve tried to be careful, and have found mistakes in other people’s genealogies that I’ve avoided.
Here is the spreadsheet in the original Numbers format (meant to be downloaded), and here it is as a web-viewable Google Sheet. The column headings show the relationship of the people to me. We managed to find all 16 of my great-great grandparents (=Great*2 in the spreadsheet), and 26 of 32 of my Great*3 grandparents. It starts to thin out from there, with 30 of 64 of Great*4. My daughter Marie and I were able to trace out one of the ancestry lines all the way to my apparent Great*30 grandparents, Brian Boru (941-1041) and his wife Echrad, and another line goes to my apparent Great*35 ones, Charlemagne and Hildegard (alive in 750).
The father of each person is in the cell to the right of that person’s, and the mother is in the next filled cell beneath the father (except when we couldn’t find the mother, in which case the next filled cell could be someone’s father — it’s easy to see when that’s the case, since there will be a filled cell to the left). Here is the portion of the ancestry leading back to Brian Boru and Echrad as an example. The King of Munster Muirchertach O’Brien is Princess Lafracoth O’Brien’s father, and Dubhchobhleigh Na Ossory is her mother. We couldn’t find Toirrdelbach O’Brien’s mother.

One of the things I’ve enjoyed the most about this project is finding examples where my ancestor’s paths have crossed mine. I first got interested in my ancestry when my father told my partner Carla and me that my great grandfather Thomas Chalmers Peebles lived in Falmouth MA. Carla I made a point of stopping by his house on the way to Provincetown. It now looks like one of my Great*8 grandparents, Jean Daigneau, was born in 1624 in Nantes, the city where my children’s mother Magda was born, and where I’ve had the pleasure of spending a lot of time. He and his wife Hélène died August 12, 1695 in Chambly Québec, “killed by Iroquois”. And the branch of my family tree that Daigneau is on, ancestors of my grandmother Pauline Valiquette (Eyler), has a lot of people who lived in Montreal, where I lived for 10 years.
My great-grandmother Maude Van Tine also has ancestors that lived in colonial North America, and one of those, Great*8 William Ross (1702-1757) was burned at the stake in Maryland in the French and Indian war. The Van Tine family name was originally Fonteyn, and the Fonteyns came to North America from France in the 17th century, settling in Bushwick Long Island. My Great*7 grandparent Johannes Fonteyn (1668-1735) was born in Bushwick, and died in Fishkill, 80 miles up the Hudson River, where the Fonteyn/Van Tines lived for several generations. His wife Catrina Willemse Cornell (1668-1711) was also a first generation New Yorker, born in Brooklyn of Dutch parents. And the wife of Isaac Van Tine (1722-1774), Mary Bogardus, is descended from Evert Willemsz Bogardus (1607 – 1647), who was born in Utrecht — another stomping ground of mine — and lived in New Amsterdam/New York. I happen to have been reading a lot of New York history and historical fiction lately (thanks to Carla, herself a native New Yorker), which makes placing some of my ancestors there particularly cool. I suspect a day trip to Fishkill (a little over 2 hrs. away) is in our future. The ancestor that I found closest to my home in Northampton MA is Great*6 Rebecca Wells, another ancestor of Maude Van Tine’s, who was born in Hartford Connecticut in 1808.
Other branches of my family came to North America more recently. Great*5 grandfather Johann Jacob Eyler was born in Germany in 1717 and died in Woodsboro Pennsylvania in 1790. His father Johan, whose last name is spelled Euler, was born in Baden-Wurttemberg in 1675, and died in Pennsylvania in 1751. John Frederick Eyler was born in Pennsylvania, and died in Frederick Maryland in 1821. My Eyler ancestors stayed in that area, now called Eyler Valley, for a long time, and there is farm built in 1820 that is in the Maryland Historical Trust, as well as an Eyler’s Valley Chapel built in 1857 that is still active, and preserves much of its historical character (e.g. no electricity). It was my great-grandfather Charles Eyler with his wife Fanna (née Wilhide) and son Vernon that moved from there to southern Ohio, where my mother was born, and met my father.
The Paters came to North America most recently, with 16-year-old Johann Heinrich Pater taking the ship Goethe from Bremen Germany, arriving in New Orleans May 1, 1849. The 1880 census has him living as Henry Pater in Hamilton Ohio, working as a tanner, and married to Mary (née Böcker), who like him was born in Merzen, a small town near the Dutch border. His mother Mary (née Gebbe) was also born in Merzen and died in Hamilton in 1861, but she didn’t seem to have traveled with her son. The Paters stayed in Hamilton, with Johann’s son Joseph (Great*2) working as a machinist according to the 1930 census. His son, and grandson (my father), both Josephs, were physicians. Our family moved to Canada in 1970, and my father, mother Elizabeth and brother Tim all live in Kingston.
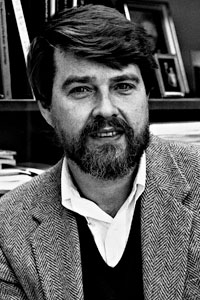
The deepest ancestral roots that I’ve been able to trace are from my paternal grandmother’s family. Her grandmother was Anne Bellingham, born in 1802 in Castlebellingham Ireland, and both of Anne’s parents have attested ancestries that go way back. Her mother is Elizabeth Jane Stewart (1775-1820), shown in this picture from a locket that hangs on my parent’s wall.

She is a direct paternal descendant of Alexander (Stewart) IVth High Steward of Scotland (1214 – 1283), who is an ancestor of the British royal family (see this post for the connection). I haven’t taken the time to put this ancestry in my spreadsheet, but here is the link for her WikiTree entry, and the paternal lineage can be easily traced from there. The WikiTree paternal ancestry goes much further back as well, and ends in Bretagne, France, around 1000. Other long lineages can be found by following the parentages of the Stewart’s wives, and some of that is shown in the spreadsheet. One of those lines goes back to Charlemagne, via my Great*5 grandmother Jane Legge (1698-1778), wife of John Stewart (1701-1784).
Anne Bellingham’s paternal ancestry is richly documented in a blogpost my daughter Marie found (it doesn’t mention Anne, but does discuss her father John). The attested ancestry goes particularly deep for my Great*5 grandmother Alice Montgomery (1717-1785), wife Allan Bellingham (1709-96), thanks to the documentation of a genealogy website focusing on the Montgomery family. It is the source of the ancestry back to Toirrdelbach O’Brien (1009-1086), who seems to be agreed to be Brian Boru’s grandson.
Sources
As an academic, I should emphasize that this is definitely not to be taken as a piece of academic work. I prioritized the quantity of information that I could gather in a relatively short time over verifying its accuracy, or detailing sources. And I am by no means any kind of genealogist.
I got a lot of use out of a trial subscription to Ancestry.com. Many of the cells in the spreadsheet are copied and pasted from the headings of their pages for those individuals. It’s quite possible that some of the information is incorrect – I did find mistakes sometimes in entries. But Ancestry did also provide access to census records, marriage records, ship manifests, and so on, that allowed for some verifications and added information.
I also found WikiTree very useful, and also copied a lot of the headings from entries there into the cells of my spreadsheet. I very much like its collaborative open format, as opposed to Ancestry.com’s paywall. The WikiTree community works towards having unique entries for individuals with verifiable information. (One of the most useful tricks I found for working in Ancestry was searching for individuals whose entries I had already found, since that would often yield better entries). More recent ancestries seem to be better documented in Ancestry.com, and older ones in WikiTree. If I find time to work on this some more, I would likely spend time improving the entries for some of my more recent ancestors in WikiTree.