From Claire Moore-Cantwell
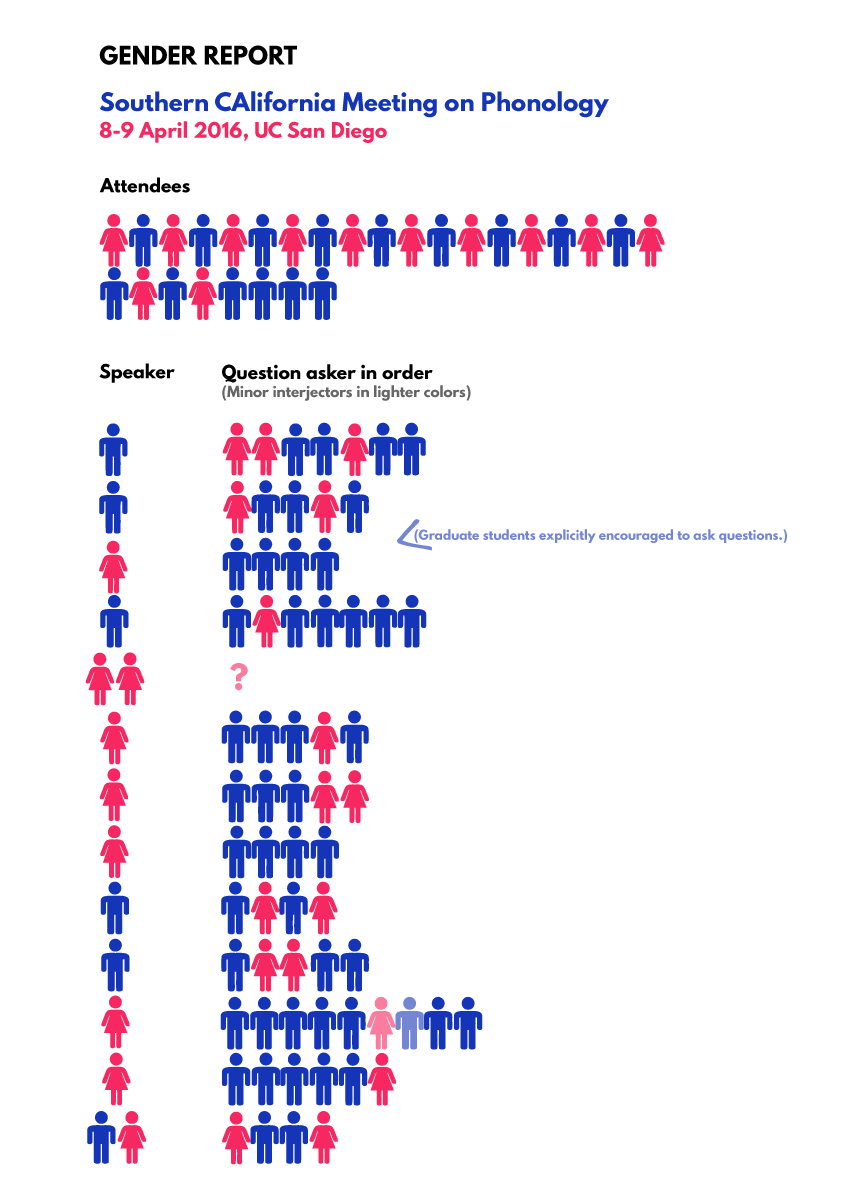
Below are some graphs of gender data collected at AMP 2016, by Jesse Zymet and Eric Bakovic. Note that unlike previous reports of this type, participants are broken down by gender, but also by whether they are a student or a professor. Post-docs and early-career linguists in visiting positions were counted in the ‘student’ category, although this choice does not change the numbers much.
To start off, I would like to point out that these graphs do not contain information about racial minorities, because phonology (and linguistics in general) is still overwhelmingly white. The fact that there are not enough racial minorities at our conferences to even include in the tallies is a serious problem with our field that should not be forgotten about.
Preregistered participants at AMP 2016, which were about 90% of total registrants, consisted of 59 male and 56 female participants. 72 participants were students and 43 were faculty. (Thanks to Karen Jesney for these numbers!)
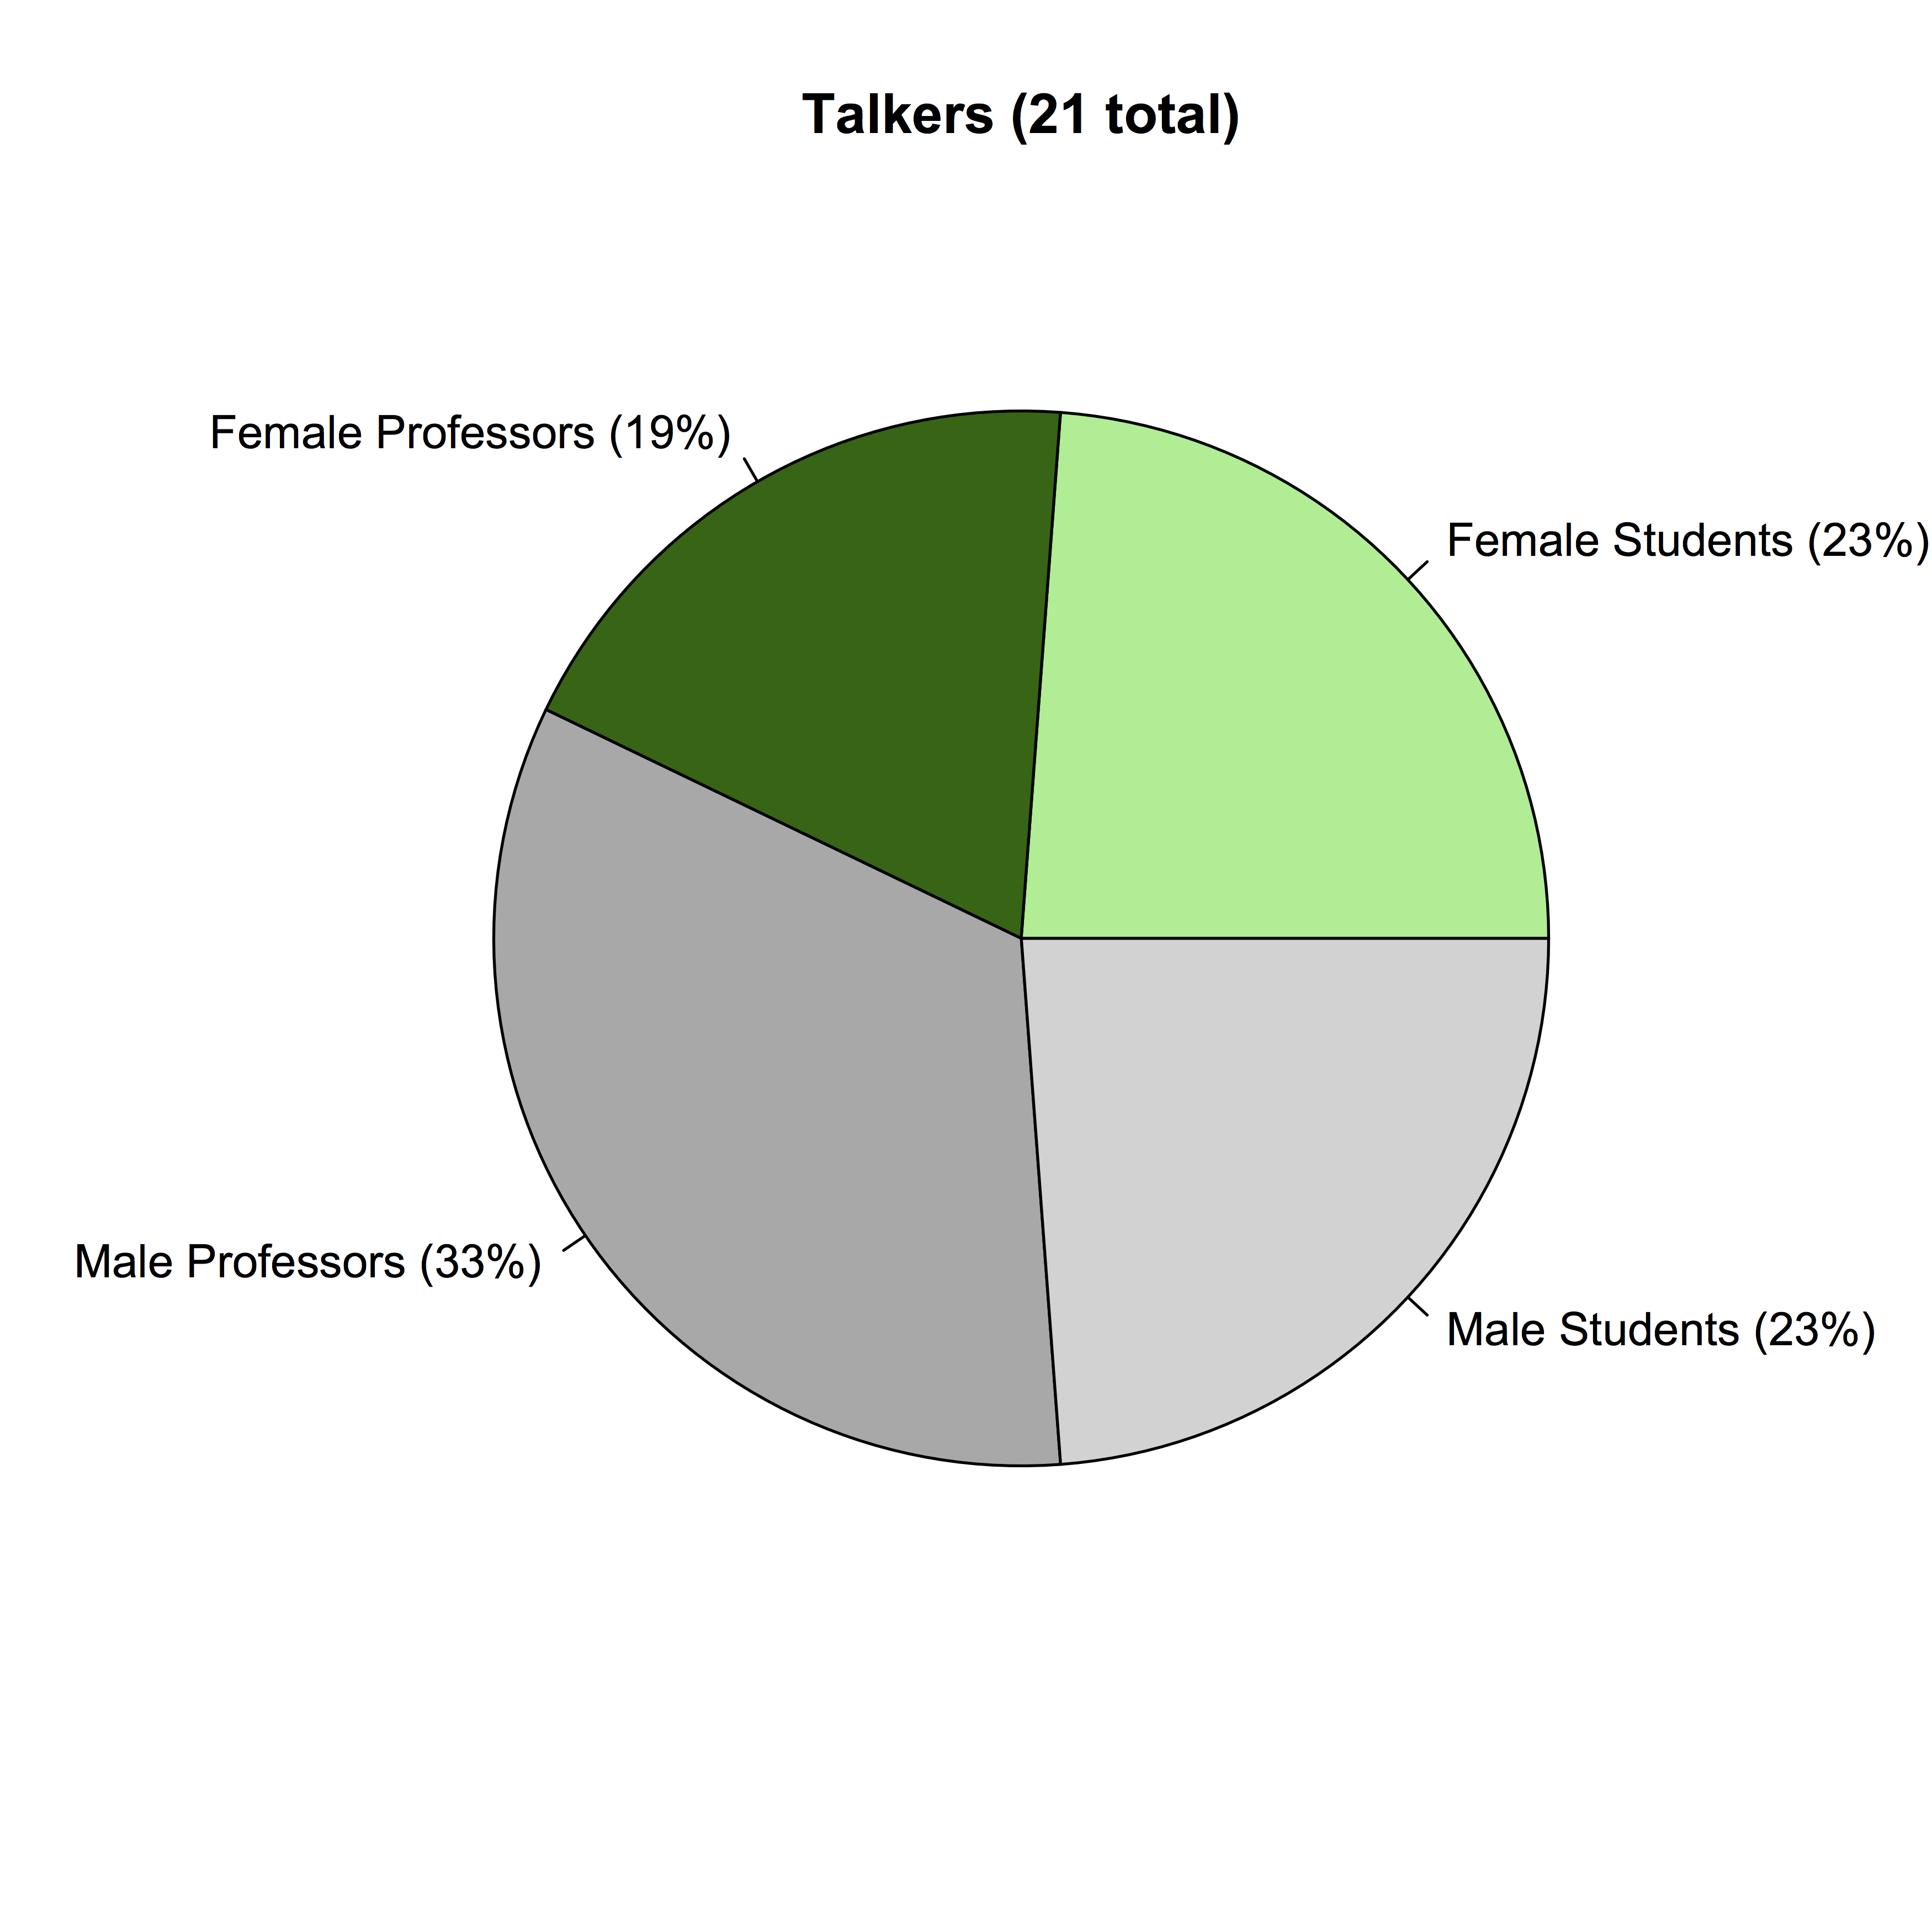
Overall, AMP 2016 had a fairly balanced set of presenters (“Talkers”), though male presenters were slightly in the majority. These numbers include the invited speakers: two male and one female.
Questions came more from faculty than from students by a small margin, and more from men than from women by a much larger margin.
Note that the difference between men and women was greater among students than among faculty (a difference of 18% vs. 9%), and the difference between students and faculty was greater among women than among men (10% vs. 4%).
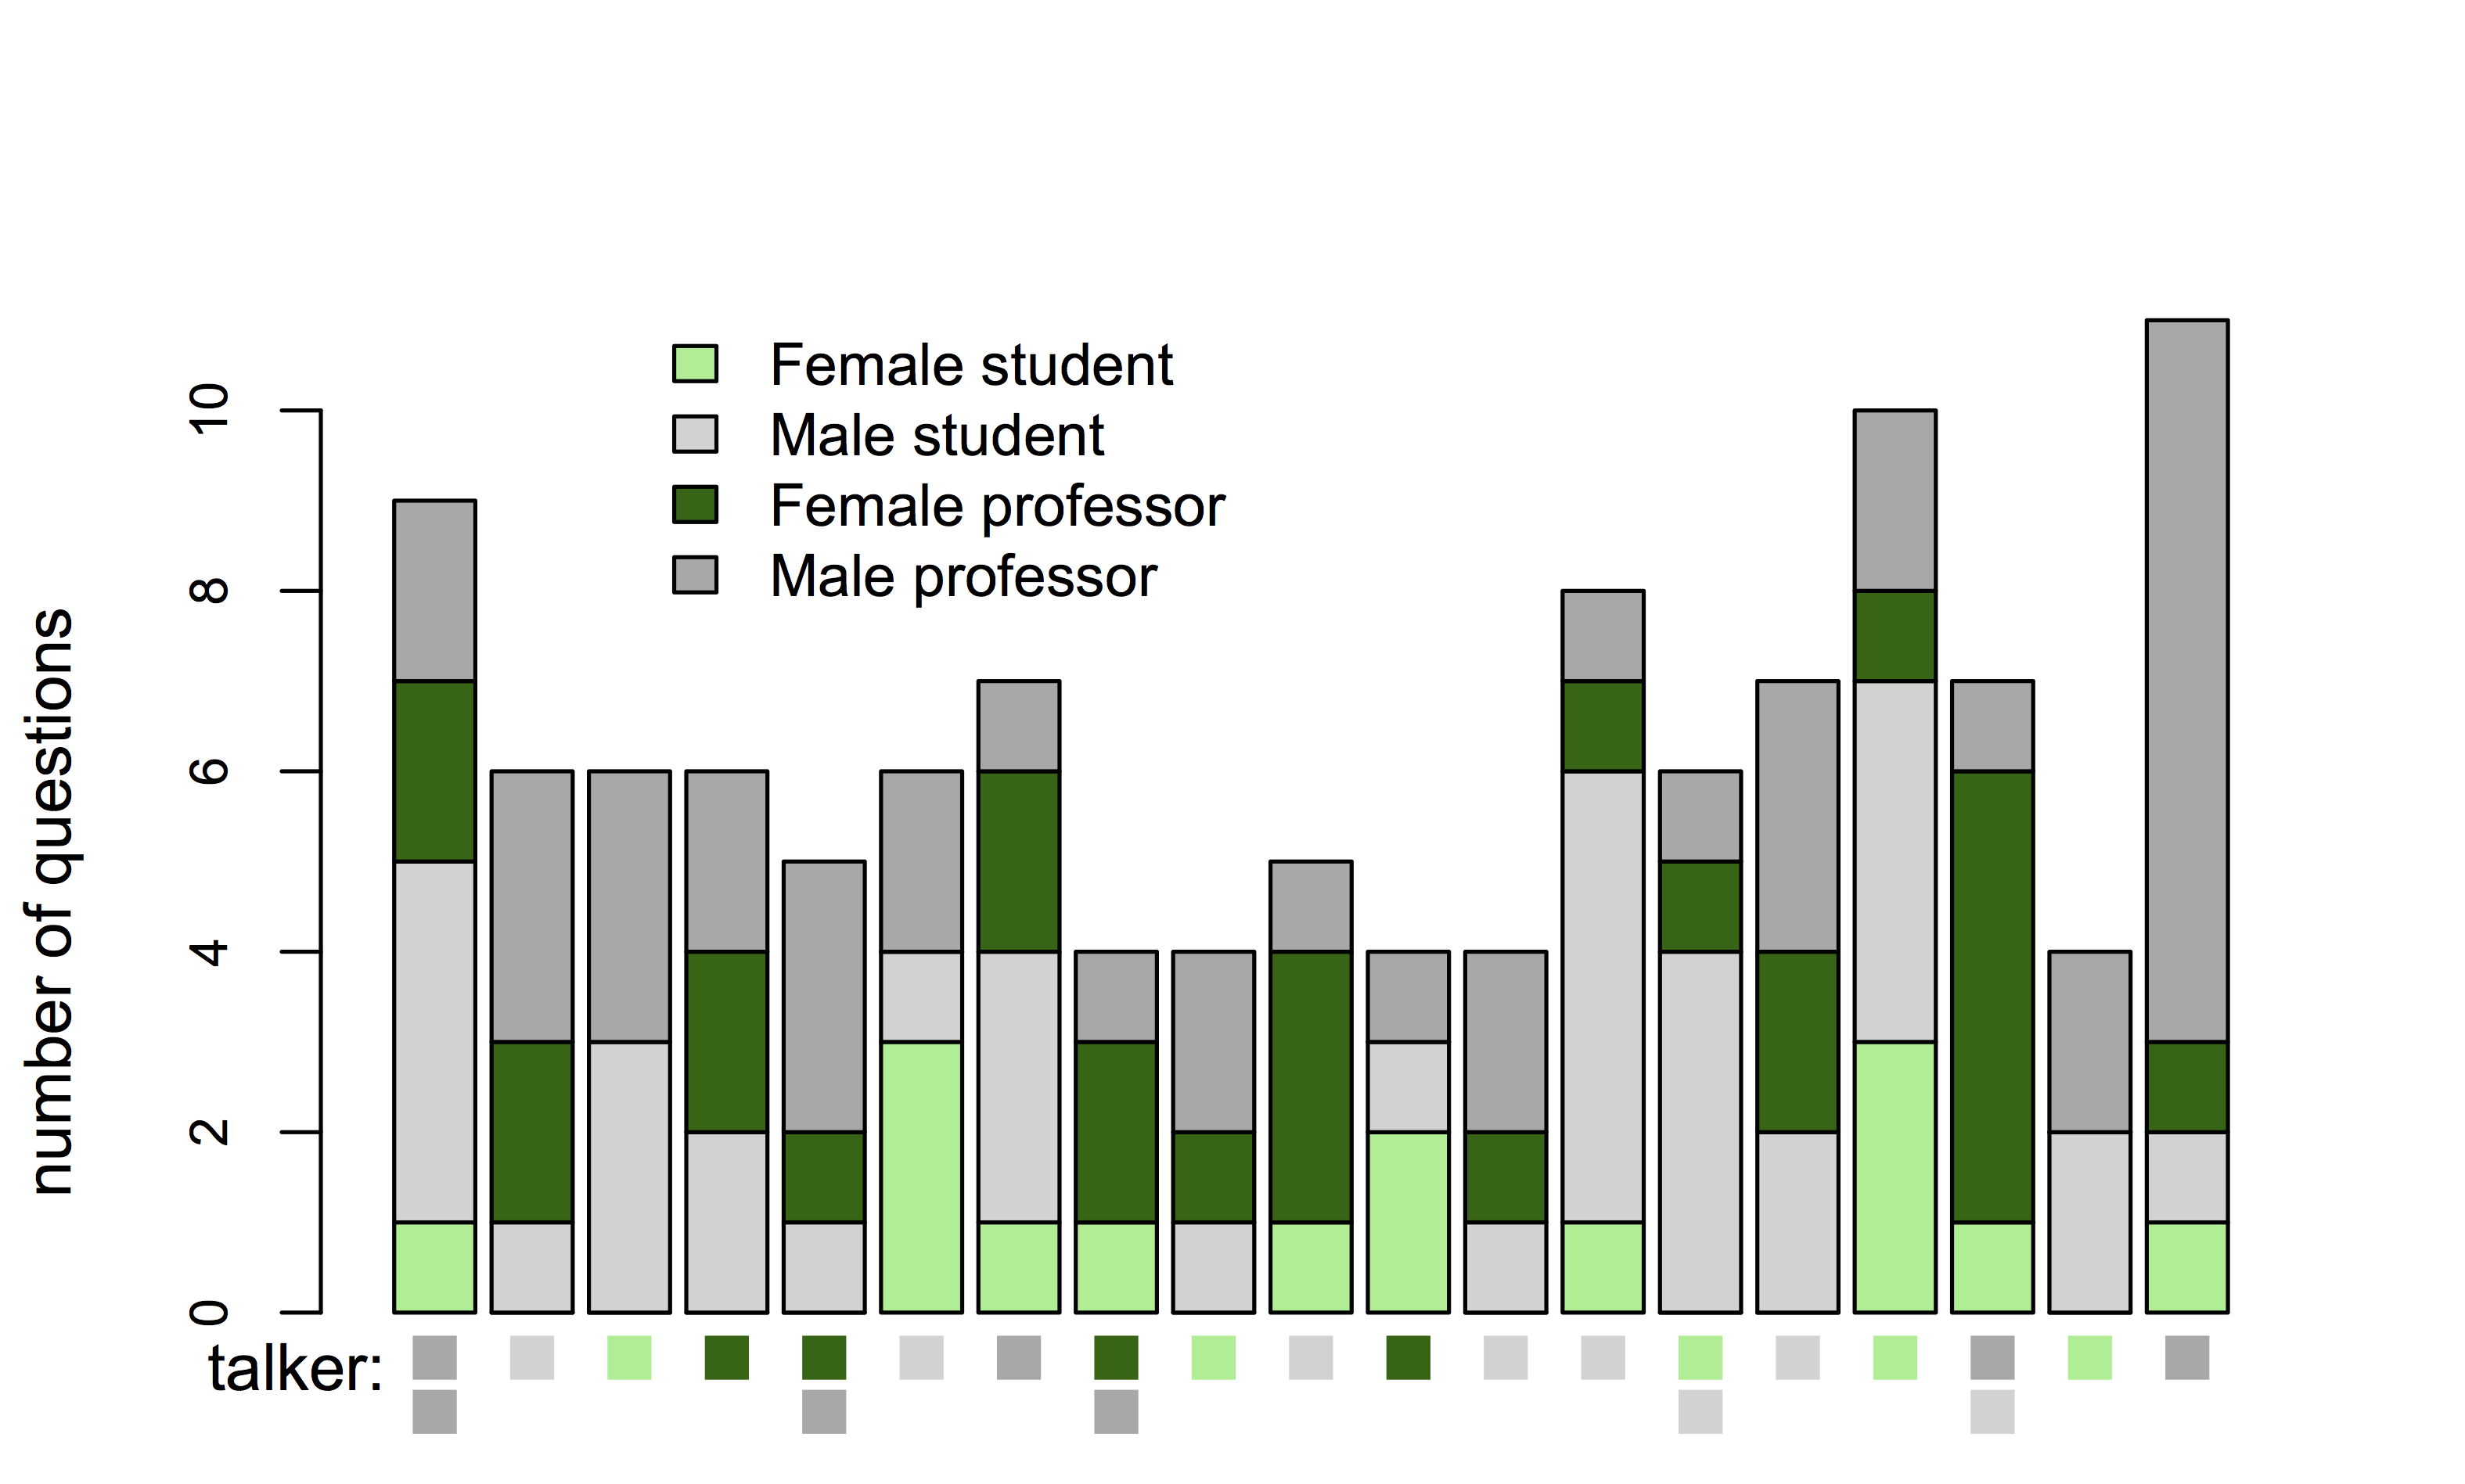
Below is the number of questions from each demographic, broken down by talk. Talks are arranged from left to right in order of occurrence in the conference, and speaker characteristics are notated below each bar.
Note that this graph does not contain information about the order of questions asked for each talk. That information is represented in the graphs below. First, let’s consider the transitional probabilities between faculty and students:
‘S’ indicated students, and ‘P’ indicated faculty (‘professors’). The probability inside each circle indicates how likely that category is to begin the questioning. Each arrow indicates the transition probability (or forward bigram probability) between two categories of questioner. For example, after a student asked a question, there was a 53% chance that a faculty member would ask a question and a 47% chance that another student would ask a question.
Interestingly, students are much more likely than faculty to begin a question period, but faculty end up asking more questions. This graph yields some insight into why: After a student asks a question, students and faculty members are about equally likely to ask the next question. However, after a faculty member asks a question, there is only a 29% chance that a student will then ask a question. Once the floor transitions to a faculty member, it tends to stay with other faculty members rather than transitioning back to students.
There are a couple of possible reasons for this dynamic – first, it might be explicitly encouraged via actual exhortations for students to talk first and faculty to hold back. I don’t remember this actually happening at AMP, but a second possibility is that the group implicitly follows this ‘rule’ simply because it’s common in linguistics, and the group generally believes in it. Yet another possibility is that students ask the first question more often just because there are more students in the audience.
Below is a similar graph illustrating question asking dynamics among the two genders for which data was gathered.
Men and women are nearly equally likely to ask the first question, with only a slight advantage for men. However, after a woman asks a question the next questioner is more likely to be a man than another woman. On the other hand, after a man asks a question, the probability that a woman will ask the next question is quite low.
Finally, here is a graph illustrating the ‘flow’ of questioning between all four groups.
The same general flow of floor time towards faculty and towards men that the previous two graphs showed can be seen in this graph as well. Additionally, this graph reveals that the transition of floor time between female students and female faculty looks somehwat different than the transition of floor time between male students and faculty. For both genders, after a student asks a question the probability that the next question comes from a student of the same gender or a faculty member of the same gender is about equal. After a female student asks a question, female faculty members and other female students are about equally likely to ask the next question, and the same is true for male audience members. However, after a faculty member asks a question, the probability that the next question will be from a male student is much higher (29% after male faculty, and 14% after female faculty) than the probability that a female student will ask a question (0% after female faculty, and a mere 8% after male faculty).


