
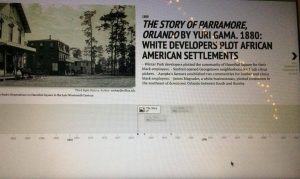
This week’s exercise relied on building a digital timeline. The project that I’m talking here is the one that I made after finishing my Masters Thesis: The Story of Parramore, Orlando. When I decided to build this timeline, I thought about as a didactic complement to the textual part of my thesis. Understanding the necessity of giving a feedback to the community that I researched, I realized that having kind of visualization would help me to spread my studies in different perspective beyond blocks of texts. Therefore, my concern was adjusting the main section of my extensive work into a shorter narrative that could be elaborated with photographs, videos, drawings or any other kind of visual possibility.
First, I realized that the process of constructing this kind of visual artifice gives an opportunity for the researcher to organize and summarize his or hers thoughts into a chronological sequence. In order to do that, I had to find the main points in my study, separate them into distinct boxes and create a coherent narrative shaping a story with an introduction and a conclusion with way less text than my thesis. The plus in this tool emerges from the opportunity of adding videos and any kind of image that the researcher would like. With this diversification, the timeline attracts visual learners to have contact with the research.
Histography, for instance, provides such amount of historical events covered by Wikipedia overlapping each other that makes the timeline a fun tool to delve into it. The tool gives a sensation of excavating history and searching for connections among dots. In the Histography you can choose for types of event (literature, inventions, disasters, discoveries), organize by time period, or even select two types of event and compare them. The case of Visualizing Emancipation the user faces a map of slavery’s end during the American Civil War. As the website affirms, One can map “the interactions between federal policies, armies in the field, and the actions of enslaved men and women on countless farms and city blocks.” The plus on this case resides on the possibility of seeing a timeline through the image of a map.
A timeline helps visual learners to understand the chronology of historic events and put them into perspective. A detailed timeline, with overlapping events, serves as visual aid for the identification of cause and effect relationships between these moments. Thus, detailed timelines may allow users to visualize different events, in different places, that occurred at the same time. Different from my thesis with 130 pages, in which sometimes it takes 5 pages to go from one historical moment to the other, my digital timeline provides the possibility of having these two historical moments right after the other in a short amount of time. Therefore, the reader is able to make a fast connection between moments facilitating the association of ideas and establishing relations in a fast way. I would not suggest using digital Timelines as the main tool of teaching or presenting information. However, it is definitely one more option to spread knowledge/telling stories.
I appreciate this defense of timelines, particularly Histography, because I found the connections you describe lacking. I also appreciate your idea that timelines are not the only summation of research, but rather about how to translate findings and arguments to different audiences. I also wonder what role timelines might play in helping historians organize their own work–in other words, is this a digital tool that historians can make use of regardless of their intention to make it public or do “public” history?
I have to admit that Sara and you are both absolutetly correct. Timelines help summarize things, break things down to the important information and help visual learners the most. Since I am not involved in any teaching, I cannot give input on that, but I can see why people use such timelines to improve their didactics.
I’m in absolute agreement with both Sara and Moritz. As a visual learner, the timeline offers both engagement and staying power. Sometimes, for myself anyway, when reading a text, I’m not always sure what the take-away is/should be as your exposed to various points and sub-points. However, the timeline offers a very succinct manner of displaying information and drives the point(s) home. In addition, because the timeline is a visual tool, it can also serve as a personal trigger which affords the space to make connections in both the personal and historical.