Digital audio again? Ah yes… only in this article, I will set out to examine a simple yet complicated question: how does the sampling rate of digital audio affect its quality? If you have no clue what the sampling rate is, stay tuned and I will explain. If you know what sampling rate is and want to know more about it, also stay tuned; this article will go over more than just the basics. If you own a recording studio and insist on recording every second of audio in the highest possible sampling rate to get the best quality, read on and I hope inform you of the mathematical benefits of doing so…
What is the Sampling Rate?
In order for your computer to be able to process, store, and play back audio, the audio must be in a discrete-time form. What does this mean? It means that, rather than the audio being stored as a continuous sound-wave (as we hear it), the sound-wave is broken up into a bunch of infinitesimally small points. This way, the discrete-time audio can be represented as a list of numerical values in the computer’s memory. This is all well and good but some work needs to be done to turn a continuous-time (CT) sound-wave into a discrete-time (DT) audio file; that work is called sampling.

During sampling, the amplitude (loudness) of the CT wave is measured and recorded at regular intervals to create the list of values that make up the DT audio file. The inverse of this sampling interval is known as the sample rate and has a unit of Hertz (Hz). By far, the most common sample rate for digital audio is 44100 Hz; this means that the CT sound-wave is sampled 44100 times every second.
This is a staggering number of data points! On a audio CD, each sample is represented by two bytes; that means that one second of audio will take up over 170 KB of space! Why is all this necessary? you may ask…
The Nyquist-Shannon Sampling Theorem
Some of you more interested readers may have heard already of the Nyquist-Shannon Sampling Theorem (some of you may also know this theorem simply as the Nyquist Theorem). The Nyquist-Shannon Theorem asserts that any CT signal can be sampled, turned into a DT file, and then converted back into a CT signal with no loss in information so long as one condition is met: the CT signal is band-limited at the Nyquist Frequency. Let’s unpack this…
Firstly, what does it mean for a signal to be band-limited? Every complex sound-wave is made up of a whole myriad of different frequencies. To illustrate this point, below is the frequency spectrum (the graph of all the frequencies in a signal) of All Star by Smash Mouth:
Smash Mouth is band-limited! How do we know? Because the plot of frequencies ends. This is what it means for a signal to be band-limited: it does not contain any frequencies beyond a certain point. Human hearing is band-limited too; most humans cannot hear any frequencies above 20,000 Hz!
So, I suppose then we can take this to mean that, if the Nyquist frequency is just right, any audible sound can be represented in digital form with no loss in information? By this theorem, yes! Now, you may ask, what does does the Nyquist frequency have to be for this to happen?
For the Shannon-Nyquist Sampling Theorem to hold, the Nyquist frequency must be greater than twice the highest frequency being sampled. For sound, the highest frequency is 20 kHz; and thus, the Nyquist frequency required for sampled audio to capture sound with no loss in information is… 40 kHz. What was that sample-rate I mentioned earlier? You know, that one that is so common that basically all digital audio uses it? It was 44.1 kHz. Huzzah! Basically all digital audio is a perfect representation of the original sound it is representing! Well…
Aliasing: the Nyquist Theorem’s Complicated Side-Effect
Just because we cannot hear sound about 20 kHz does not mean it does not exist; there are plenty of sound-waves at frequencies higher than humans can hear.
So what happens to these higher sound-waves when they are sampled? Do they just not get recorded? Unfortunately no…

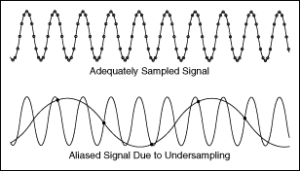
So if these higher frequencies do get recorded but frequencies above the Nyquist frequency cannot be sampled correctly, then what happens to them? They are falsely interprated as lower frequencies and superimposed over the correctly sampled frequencies. The distance between the high frequency and the Nyquist frequency govern what lower frequency these high-frequency signals will be interpreted as. To illustrate this point, here is an extreme example…
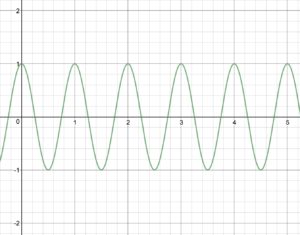
Say we are trying to sample a signal that contains two frequencies: 1 Hz and 3 Hz. Due to poor planning, the Nyquist frequency is selected to be 2 Hz (meaning we are sampling at a rate of 4 Hz). Further complicating things, the 3 Hz cosine-wave is offset by 180° (meaning the waveform is essentially multiplied by -1). So we have the following two waveforms….


When the two waves are superimposed to create one complicated waveform, it looks like this…

Pretty, right? Well unfortunately, if we try to sample this complicated waveform at 4 Hz, do you know what we get? Nothing! Zero! Zilch! Why is this? Because when the 3 Hz cosine wave is sampled and reconstructed, it is falsely interpreted as a 1 Hz wave! Its frequency is reflected about the Nyquist frequency of 2 Hz. Since the original 1 Hz wave is below the Nyquist frequency, it is interpreted with the correct frequency. So we have two 1 Hz waves but one of them starts at 1 and the other at -1; when they are added together, they create zero!
Another way we can see this phenomena is by looking at the graph. Since we are sampling at 4 Hz, that means we are observing and recording four evenly-spaced points between zero and one, one and two, three and four, etc… Take a look at the above graph and try to find 4 evenly-space points between zero and one (but not including one). You will find that every single one of these points corresponds with a value of zero! Wow!
So aliasing can be a big issue! However, designers of digital audio recording and processing systems are aware of this and actually provision special filters (called anti-aliasing filters) to get rid of these unwanted effects.
So is That It?
Nope! These filters are good, but they’re not perfect. Analog filters cannot just chop-off all frequencies above a certain point, they have to, more or less, gradually attenuate them. So this means designers have a choice: either leave some high frequencies and risk distortion from aliasing or roll-off audible frequencies before they’re even recorded.
And then there’s noise… Noise is everywhere, all the time, and it never goes away. Modern electronics are rather good at reducing the amount of noise in a signal but they are far from perfect. Furthermore noise tends to be mostly present at higher frequencies; exactly the frequencies that end up getting aliased…
What effect would this have on the recorded signal? Well if we believe that random signal noise is present at all frequencies (above and below the Nyquist frequency), then our original signal would be masked with a layer of infinitely-loud aliased noise. Fortunately for digitally recorded music, the noise does stop at very high frequencies due to transmission-line effects (a much more complicated topic).
What can be Learned from All of This?
The end result of this analysis on sample rate is that the sample rate alone does not tell the whole story about what’s being recorded. Although 44.1 kHz (the standard sample rate for CDs and MP3 files) may be able to record frequencies up to 22 kHz, in practice a signal being sampled at 44.1 kHz will have distortion in the higher frequencies due to high frequency noise beyond the Nyquist frequency.
So then, what can be said about recording at higher sample rates? Some new analog-to-digital converts for musical recording sample at 192 kHz. Most, if not all, of the audio recording I do is done at a sample rate of 96 kHz. The benefit to recording at the higher sample rates is that you can recording high-frequency noise without it causing aliasing and distortion in the audible range. With 96 kHz, you get a full 28 kHz of bandwidth beyond the audible range where noise can exist without causing problems. Since signals with frequencies up to around 9.8 MHz can exist in a 10 foot cable before transmission line effects kick in, this is extremely important!
And with that, a final correlation can be predicted: the greater the sample rate, the less noise will result in aliasing in the audible spectrum. To those of you out there who have insisted that the higher sample rates sound better, maybe now you’ll have some heavy-duty math to back up your claims!
