This past week featured a microscopy session that made me as tense a G string. Before getting to that… As alert readers know, last weekend I posted nothing. Why? Because, as Google knows, during the week I had visitors to the cottage: my beloved partner Laura and our pal from grad-school days Marta Laskowski. With her daughter visiting Martha’s Vineyard, Marta took the opportunity to come with her as far as the ferry dock and spend 5 days enjoying the sciencey breezes of Woods Hole. Those balmy airs certainly cooled the three of us: we lolled about the cottage writing and editing, we took in a few lectures at Lillie, occasionally walked along the beach wetting our toes, and did some idle tourism too. A relaxing week, but one with little lab work.
The following week, with visitors gone I returned to the lab. Because of a missed communication, Eri had given me regular BY2 cells, not the line that can be induced to make xylem. But I can do plenty with the regular cells.
I have been imaging the cells with polarized fluorescence, providing raw images to feed into algorithms to build a valid representation of the organization of cellulose around the cell in three-dimensions (outlined in an earlier post). Building the algorithms is out of my hands. However, this effort will succeed to the extent that the dye binds reliably to the cellulose. Does it? So far, I have seen that stained cells emit polarized fluorescence, yay! To check out the characteristics of the fluorescence, I decided to compare polarized fluorescence anisotropy to birefringent retardation. The latter depends only on light interacting with the cellulose and can be considered as a kind of ground truth – anyway the uncertainty surrounding dye binding is removed.
There is a practical problem though. The binding of an absorbing molecule (like a dye) will in principle alter the apparent birefringent retardation. Since I am only adding enough dye to image the sample in fluorescence there is not a ton of absorption going on (the cells do not look ‘colored’ by eye) but there might be enough to interfere. In the best case, I could take a cell, image it for birefringence, stain it and then image for polarized fluorescence. But doing so would be … a challenge. Rudolf came up with a plan: stain the cells, measure the polarized fluorescence and measure birefringent retardation not only in green light (the wavelength used to excite fluorescence) but also in blue, where the dye hardly absorbs at all. With such low absorption, birefringent retardation in the blue will immune to interference from the dye. Clever.
I did this. I found a cell, imaged a series of focal planes in green birefringence mode and found a focal plane that included a swath of cell wall. Then, keeping the focal plane constant, I took images of polarized fluorescence and of birefringence in blue. And because all of that was not enough, I also imaged di-attenuation – which is a fancy word for polarized absorption. The reasoning here is that if the dye is binding strongly enough to interfere with the birefringence measurement, then that might be strong enough to see via absorption.
The above paragraph rolled off my fingers in a moment, but doing the imaging was something else again. Each of the four imaging modes requires specific settings for both software and hardware. Super easy to forget one little thing, and poof! Three of the modes require capturing a unique background image right next to each cell (to correct for whatever signal the slide and microscope optics are contributing). I had to remind myself, more than once, to breathe.
In the end, I captured all four imaging modes correctly (I think!) for five fields of view. Then I measured the same region of a cell wall in the four modes, repeating for all of the imaged cells. Figure 1 shows the relation between birefringent retardation in green (544 nm) and blue (482 nm). Each point is one cell wall area. There are more than five points because the 5 fields of view each had more than one cell. The points fall along a line, which they should. But the slope of the line equals about o.5, meaning the signal in the green is about twice the signal in blue. Ergo interference, possibly from the dye-binding or possibly from something else.
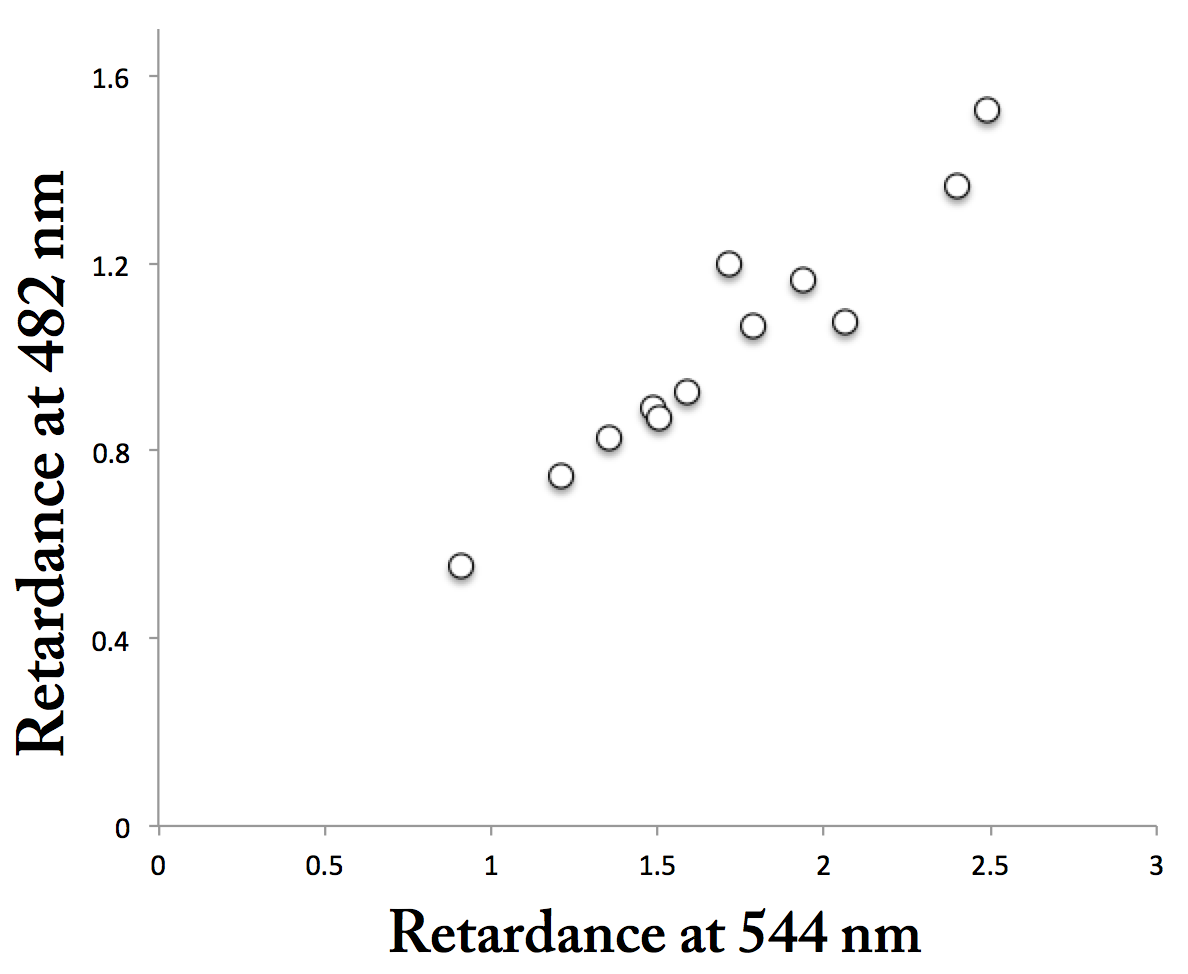
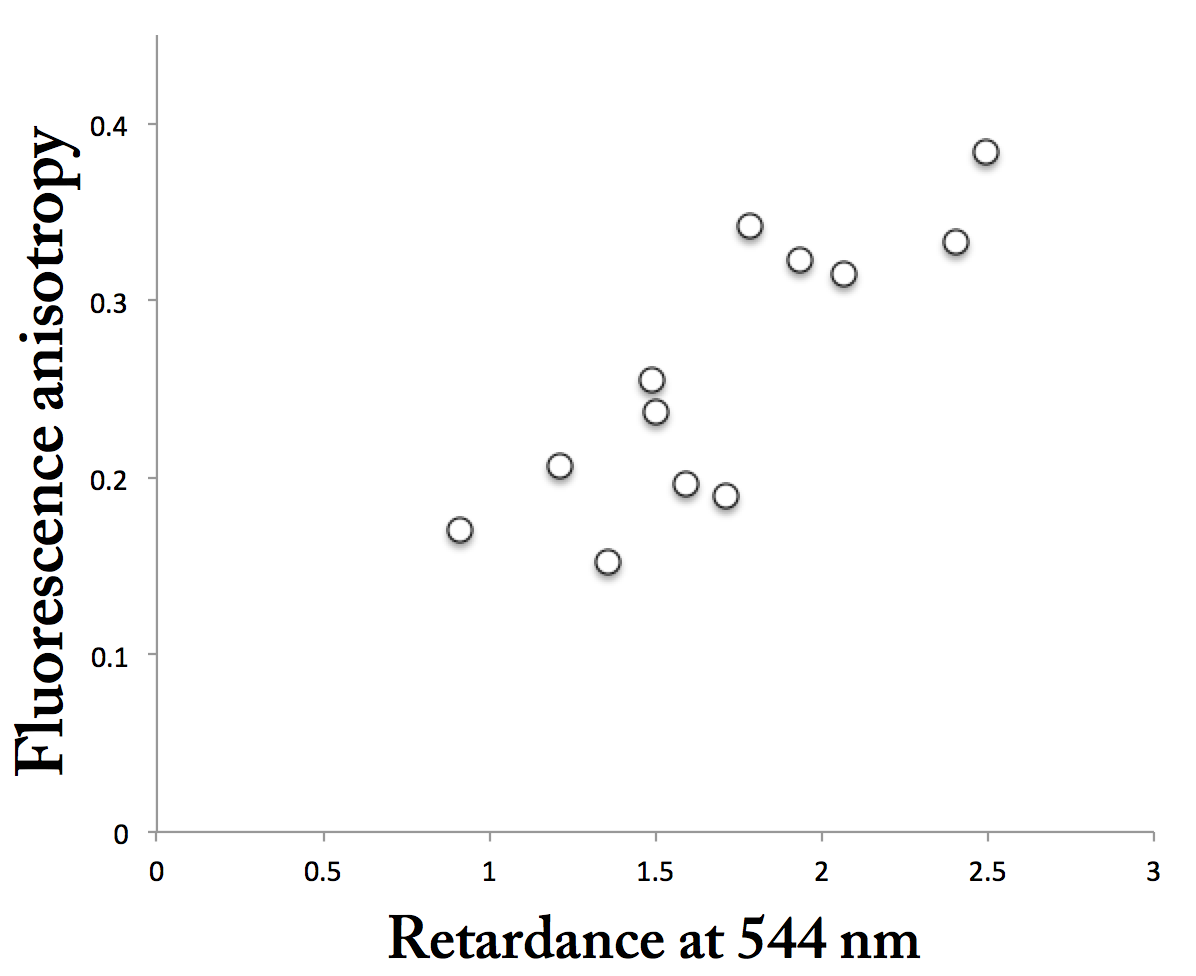
Figure 2 plots the relation between birefringent retardation in green (544 nm) and polarized fluorescence. These points also fall along a line. At face value, this implies that the cell walls with stronger birefringence are more ordered, rather than being thicker (the anisotropy of the polarized fluorescence should not respond to thickness). Furthermore, the linear relation is consistent with the dye interfering with birefringent retardance. On the other hand, the di-attenuation values were essentially zero, meaning that there was not enough absorption by the dye to cause a signal. I don’t think that rules out the dye’s interfering with retardance data, but perhaps makes that less likely.
Many stories can be spun around these graphs. But before going there, I need to know about the relation plotted in figure 1 for un-stained cells. That is to say, the slope being less than one might have nothing to do with the dye and everything to do with the microscope optics or even with biology, if one or another of the refractive indices of cellulose is a function of wavelength. And that is what I did later in the week. I imaged a bunch of not-stained cells in both blue and green for birefringent retardance (since they were un-stained I didn’t have to mess with polarized fluorescence or di-attenuation). This coming week, I get to measure them. Bets anyone?