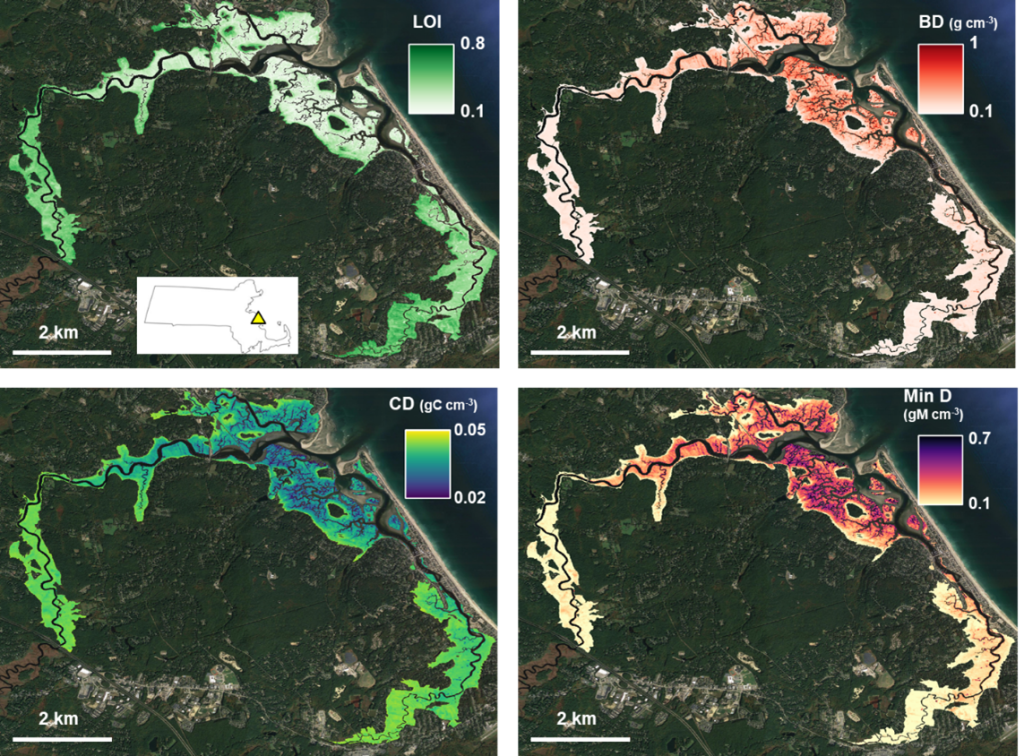
Blue Carbon – with collaboration from NRCS scientists, UMass graduate students Wenxiu Teng and Bonnie Turek, as well as faculty collaborators Qian Yu, Jon Woodruff, Tim Cook, and Justin Richardson, we have produced detailed maps of modeled salt marsh soil properties for the entire Northeast US. These data layers are available for download from the NRCS AgDataCommons, here.
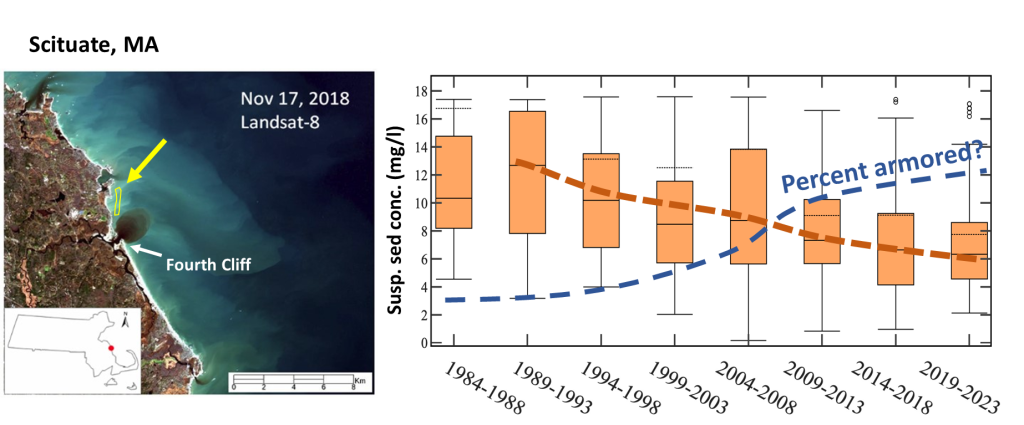
Impacts of Coastal Armoring on Littoral Zone Sediment Supply – When the coastal erosion occurs, all that eroded soil ends up in the coastal zone. Coastal erosion has been occurring for thousands of years, with the soil supplied from crumbling bluffs being sloshed around to form the coastal environments that we love – beaches, shellfish beds, and salt marshes. As we harden the coast with bulkheads and walls, we shut off that supply of sediment.
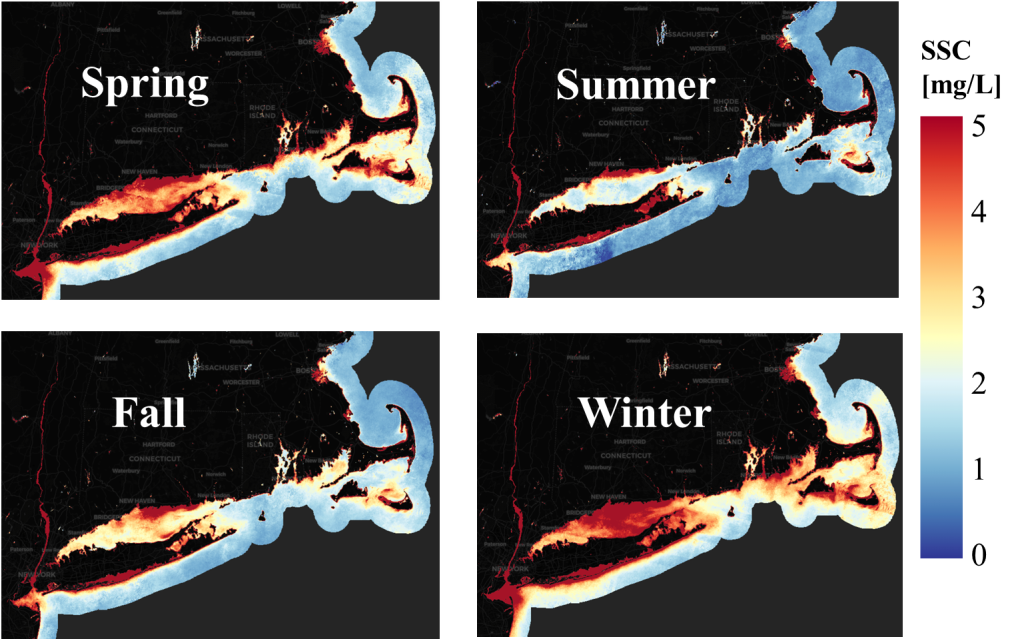
With colleagues Qian Yu, Wenxiu Teng, and Jon Woodruff, we are investigating to what extent coastal sediment supply is declining in response to increased armoring. Furthermore, do we see sediment deficits in marshes as a result of potential sediment declines. Preliminary results from this work have shown widespread decreases in the amount of suspended sediment in the Northeast coastal zone since 1984 based on an analysis of ~40,000 satellite images. We are currently working to quantify exactly how much sediment is being robbed from the coastal zone by armoring. Furthermore, we are working with stakeholders to discuss what creative solutions we can envision to replenish sediment at the coast.
Impacts of the Energy Transition on Water and Soil Resources – the world desperately needs renewable energy to be deployed. And FAST! At the same time, the massive changes coming to how we produce and move electricity will have dramatic impacts on habitats and natural systems. I am interested in two aspects of the energy transition.
- How does utility-scale solar development impact hydrologic process and soil properties?
