A Reflection on Student Work Samples: Ultraviolet Blocking Potential of Various Lotions, Creams, and Oils

IMG_3354

This is the last of a series of three posts that address a controlled experiment, which investigated the UV blocking potential of a variety of lotions. See my earlier posts dated May 17th, 2016 and December 20th, 2015 for additional information. The 12/20 post focused on project goals/objectives, resources, a description of the activity, and assessment standards. The 5/17 post dealt more with how the activity was implemented in the classroom. In this post, I will share my conclusions from the results of four student work samples from honors chemistry (Student work sample #1Student work sample #2Student work sample  3; Student work sample #4), as well a compilation of research team data from my two general chemistry classes (UV Blocking Class Data Table).  The identities of the 8 lotions (A-H) are listed at the bottom of this table.

The student work samples are wholly the product of the student’s themselves. As an end of year summative assessment of student’s ability to execute and report on a controlled experiment, I provided no written comments from which students could make revisions in preparation for their final draft. I did, however, answer specific questions individuals may have asked of me at any point during the project. I also provided a set of project guidelines (see May 17th for details). Student research teams were provided with the problem, and a set of verbal instructions for how to perform the experiment. However, I did not explicitly identify the experimental, depended, and relevant control variables. As such, I would classify this activity as a guided inquiry, although I made an effort to keep the guidance to a minimum.

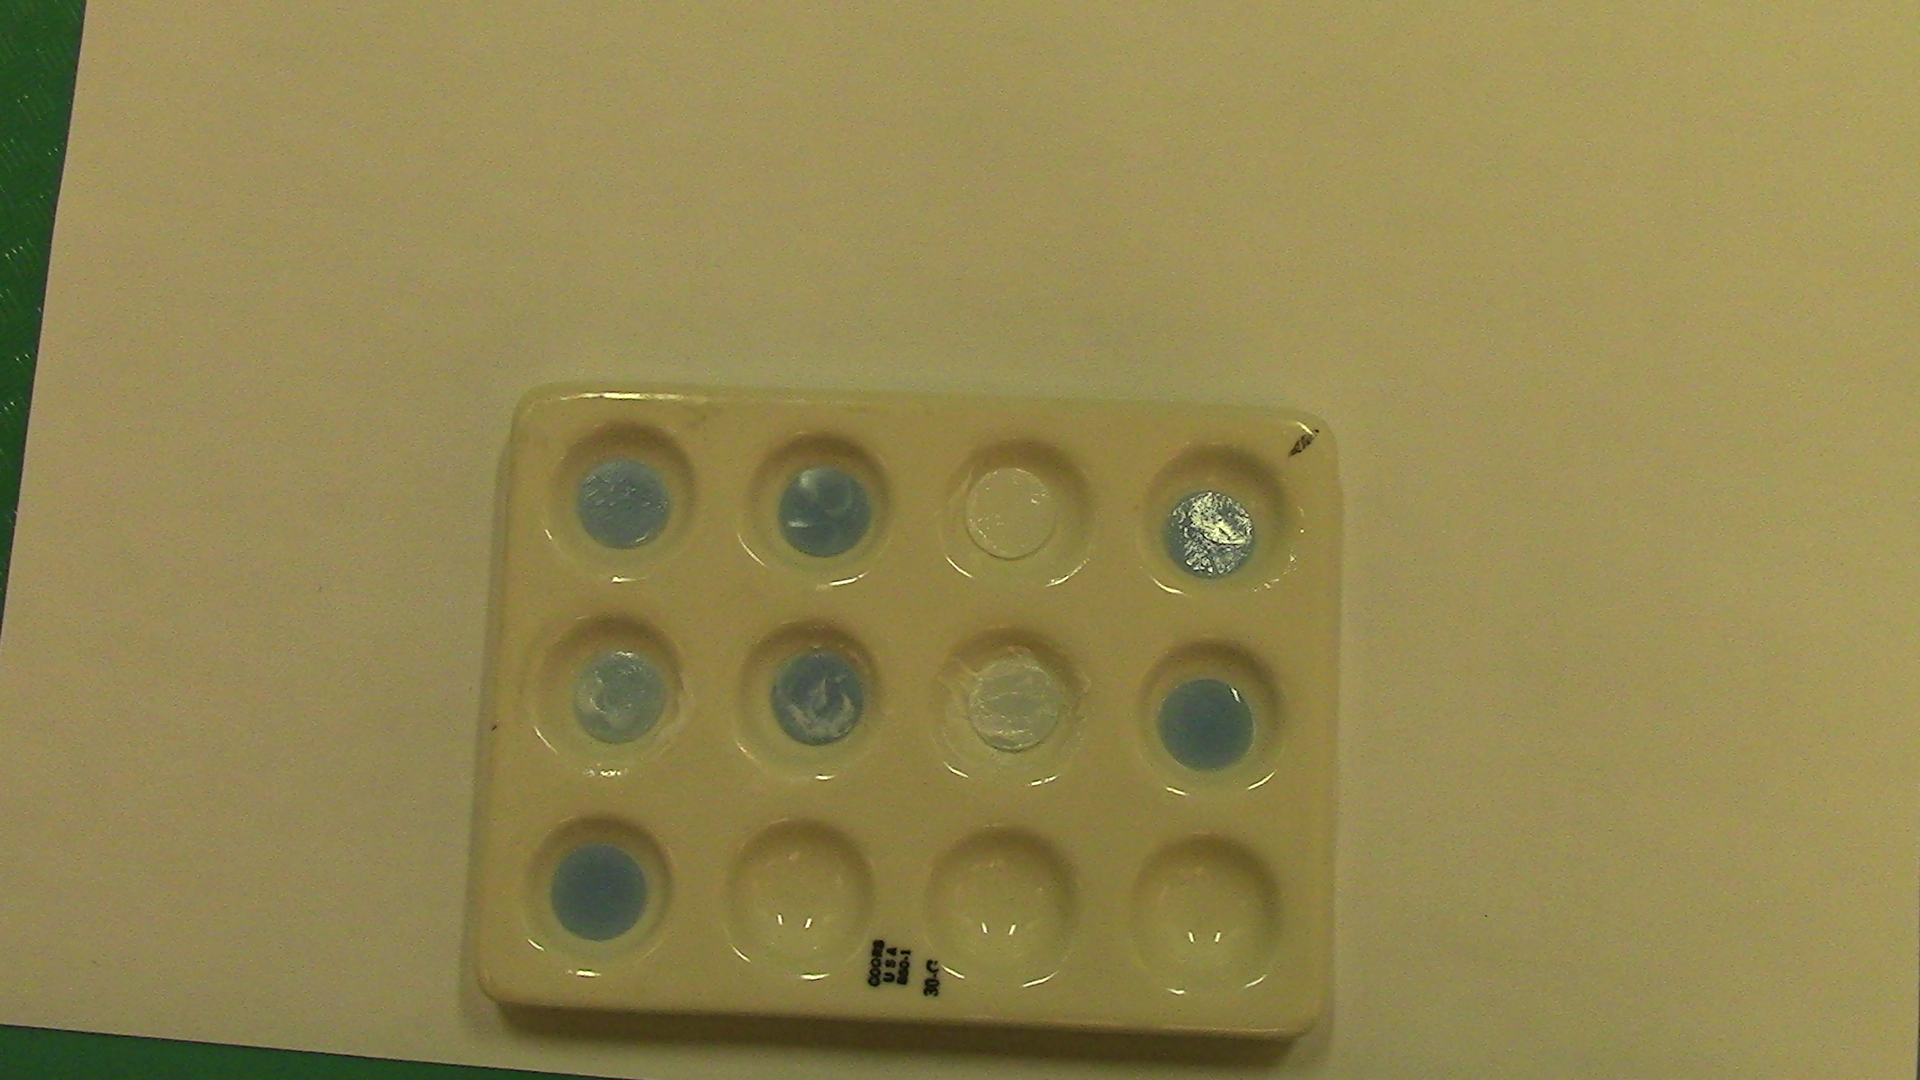
All students qualitatively analyzed their results by ranking UV blocking potential based on visual observation. As an extension, my honors chemistry students also used Analyzing Digital Imaging (ADI) software in an effort to quantify their experimental results by analyzing digital photographs. Curious to see what students would come up with on their own, I provided no instruction in how to use the ADI software to quantifiy UV blocking potential of the lotion coated beads.

Below is a bullet point list of my general observations from this project.

  • Student’s demonstrated a sound understanding of how to write a technical report. Report sections were clearly labled, with the relevent information included.
  • Nearly all student’s successfully identified the expereimental, dependent, and relevant control variables.
  • Student’s generally did a good job of identifying sources of error and making recommendations for how these errors could be minimized if the experiment were repeated.
  • While many research teams opted to perform multiple trials of their experiment, very few understood the importance of summarizing the results of multiple trails by calculating an average. This came as a surprise to me, as we have calculated average values in numerous other experiments performed earlier in the year. As a post experiment exercise intended to demonstrate how averages can help inform our decision making, we compiled data across all research teams. The average results did indeed prove more accurate than the conclusions of any one research team (see UV Blocking Class Data Table1 above).
  • Through their own background research, I had presumed that most students would identify the possible link between ozone layer depletion, increased UV exposure, and increased rates of skin cancer. Although a few students did make this connection (see Student Work Sample #2), most did not.
  • Students are prone to making claims based on conjecture, unsubstantiated by even secondary sources of information, when performing background research.
  • The results from analysis using ADI software were problematic due to the presence of glare in student photgraphs. Of greater concern, however, was that while most teams were able to develop a method for using ADI to interpret their data, very few student’s reported on these results successfully. They posted well organized tables of ADI data in the results section of their report, but neglected to describe (in the procedure) how the analysis was performed, and also failed to to explain the meaning of their data (in the discussion). One noteable exception is here.
  • Students did a good job of listing their background references using MLA format on a citations page. However, it was impossible to link these sources to the specific content of a student’s background statement. This is entirely an error made by me, as I neglected to teach my student’s how to use the (Author, date) scientific style of referencing citations. I will surely address this shortcoming in the future.
  • As a broad final conclusion, my honors level students are quite adept at following directions and demonstrating aquired skills when prompted. But they are less succssful at then applying their new knowledge and skills independently in novel prolem solving situations. To address this shortcoming, I feel students need more opportunities to work on open ended problems and have the freedom to make mistakes. Rather than correcting mistakes as they happen (or before they happen), we as teachers should provide more opportunities to allow mistakes to happen, and address them later.

Investigating the Ultraviolet Blocking Potential of Various Lotions, Creams, and Oils.

20160502_111554UV beads

This is a follow up to my earlier post dated December 20th, 2015, entitled “Nanoparticles and Sunscreen Ultraviolet Protection Investigation.”  That post provided a project overview as well as communicating the goals, objectives, and rationale.  Useful resources and materials are also listed along with the science learning standards addressed, and an outline of student activities.

Included here: UV Protection from Lotions Lab, is the handout I provided students to help guide them through this multi-day unit of instruction.  To facilitate cooperative learning among members of each research team, students adopted the role of either Project Manager, Data Technician, or Equipment Manager.  Groups larger than three students would have more than one equipment manager.  We devoted some time in class discussing these roles to ensure that there was an equitable differentiation of responsibilities.

The project manager is responsible for coordinating the group’s activities, bringing questions to the instructor (teacher), and relaying instructions back to the group. The data technician is responsible for signing-out a laptop computer, creating the data table, and disseminating the experimental results to each member of the research team (via email or shared using Google docs).  The data technician also plays a leading role in working to ensure that the experimental data is as accurate as possible.  The equipment manager is primarily responsible for signing out all other materials (such as the UV lamp, UV beads, and test lotions), as well as ensuring that all members of the research team participate in cleaning up and returning equipment at the end of class.

Space is provided in the handout for students to pencil in a rough draft of their materials list, procedure, and a blank data table.  Research teams may not begin their experiment until these draft details are approved by the instructor.  The final draft lab report, including 500 word background research must be typed.

In a future post (coming very soon), I will share some examples of student work.  Below I’ve included a few photographs of the experimental set up.

  1. Mystery lotions A-H, loaded into individual micro-tubes for easy distribution among research teams.

20160502_111541

2. Using a cotton swab to apply a thin layer of lotion to each of 8 UV sensitive beads (previously separated by color).

20160502_111308

3. One of three UV-Lamp stations, a well plate holding 8 lotion-coated UV beads, and a 9th non-coated bead as a control.  Also visible is a student’s draft data table.

20160502_111352

4.  Digital camera station to record the raw data of UV light exposed beads.

20160502_111458


The Potato Battery Controlled Experiment

Lesson Overview: The Potato Battery Controlled Experiment

Goal: In this acivity students work in teams to construct simple potato batteries and design a controlled experiment, which investigates how a variable of their own choosing influences (if at all) the voltage produced by their battery. Student teams then share the results of their experiments in a short presentation format. Individually, students write laboratory reports documenting their understanding of the potato battery.

The following materials are provided:

  • Multimeter
  • Wires with alligator clips.
  • Metal strips (copper, zinc, aluminum, iron, tin, magnesium, silver, etc…)
  • Potatoes.
  • Additional fruits/vegetables (lemon, apple, etc…)

Objectives:
1) Students will gain experience working in collaborative teams by designing and performing an open ended controlled experiment.

2) Students will be able to define and identify the experimental variable, dependent variable, and at least three control variables.*

  1. Students will rank variables in terms of the effect on voltage. (no effect, small effect, large effect).

*Advanced students may also investiate how their chosen experimental variable affects current. In essence, performing two controlled experiments concurrently. However, if this is their first experience designing a controlled experiment, it may be advisable to have students focus on one dependent variable (voltage) to avoid confusion regarding the elements of experimental design. The electrical current tends to be vary small and highly variable, even under optimal circumstances, so I recommend focusing on voltage.

Rationale:

Avoid over-teaching!! I’ve made this mistake myself too many times. This activity provides students an excellent opportunity to teach themselves and learn from one another. Teacher’s should wait unit the final closure of the lesson series to provide deeper direct instruction.

I’ve used this lesson to teach experimental design principals in my general chemistry classes, and as an introduction to the more complex Galvanic cells covered by my advanced (honors) course, as well as AP Chemistry. It would also work well in a general science course, introductory physics, or a science elective (such as my Sustainable Energy course). While the potato battery experiment provides an opportunity to reinforce chemistry concepts such as the metal activity series (EMF series), electrolytes, and oxidation-reduction (Red-ox), prior knowledge of basic chemistry is by no means a requirement. I would even argue that this mini-unit is most successful, in terms of student engagement, when presented very early in the learning sequence. The experiential (“hands-on”) context provides a foundation for students, upon which more abstract concepts may scaffolded later on.

At minimum, however, students should have some prior knowledge of voltage (electromotive force), current, and resistance. Relating these variables mathematically, using Ohm’s law (V = I x R), is optional. What follows are some useful qualitative definitions of terms. Depending on where your students are in their learning progression, you may choose to address each of these in greater detail (and more quantitatively), than I do here:

Prior Knowledge:

I provide a handout that explains how to design a simple controlled experiment: How does sunlight affect plant growth? Since most middle and high school students already know the outcome, this simple question serves as a good model, allowing students to focus on understanding terms like experimental variable, dependent variable, and the need for control variables.

Key terms:

Voltage (electrical potential, electromotive force) is the stored potential energy that exists whenever there is a separation between charged particles. Sometimes described as electrical pressure, voltage is the “push” that may set electrons in motion through an external conducting circuit (that is, if we choose to view electrons themselves as particles). The unit of measure is derived from units of energy divided by units of electrical charge (Joules/coulomb). It is analogous (similar in some ways, but not equivalent) to the gravitational potential energy that exists between particles that have mass.

Current is the flow of electrons past a given point in a conducting circuit. The unit of measure is derived from units of electrical charge divided by units of time (Coulombs/second). The term “Ampere” or “Amp” is frequently used in its place (1 Amp = 1 C/sec). It is analogous to the flow of water through a hose (liters/second, for example). The coulomb itself needs defining: I’ve found that the simplest way is to think of the coulomb as a count, analogous to the dozen, but a much, much larger count. One coulomb is equal to 6.2 x 10¹⁸ electrons. Therefore, a current of 1 Ampere is equal to a flow rate of 6.2 x 10¹⁸ electrons/second.

Resistance is just that. It is the resistance to the flow of electrons, analogous to friction. Even good conducting materials, such as the copper metal in a wire, impose some resistance against the flow of electrons in a circuit. Appliances (“loads”) such as light bulbs and computers, impose greater resistance.

Taken together, every electrical circuit (a loop of wires + loads) requires a minimum voltage (push) to overcome the resistance (friction), thus producing a current (electron flow). This is a qualitative statement of Ohm’s Law.

Pre-activity:

Once students have a handle on terminology, I instruct them in how to use a multimeter to measure DC voltage. Next, I show them a schematic diagram of a potato battery (the identity of the metals is not indicated). I then ask students, working in teams, to brainstorm variables that may have an effect upon the voltage produced. (ex: type of fruit/vegetable is always popular, mass of potatoes, condition of potatoes—peeled, juiced, etc.., guage of wires, types of metals—pairs of the same metals, or combinations? Let the students investigate this—depth of insertion, distance apart, type of connection between two batteries—series vs. parallel, and so on…). Teams then choose one variable from the list as their experimental variable, and get to work designing their experiment. It’s important to ensure that different teams choose different variables—if possible—so teams can share their results at the end and learn from one another. Also, its essential that at least one team chooses to investigate how different metal pairs affect voltage. For all other teams, I provide a copper and zinc strip.

This project is a near guarantee of student engagement.  Good luck!

Introduction to the Bohr model of Atomic Structure

My Sustainable Energy course is an elective that draws students from various grades and levels of learning.  Some have had chemistry, even Advanced Placement, but many others have not.  I find that some basic understanding of atomic structure and chemical bonding helps raise student interest in many topics relevant to Sustainability, such as the photoelectric effect.  So, with this in mind, I’ve developed a brief introduction to the Bohr model of atomic structure for students who have not completed a full first year course in chemistry.  Enjoy. Suggestions or other feedback are encouraged! Intro to Bohr Model

Nanoparticles and Sunscreen Ultraviolet Protection Investigation

Here is another project I expect to pilot in the classroom late winter or spring.  There is a wealth of information on the topic at http://nanosense.sri.com/activities/clearsunscreen/index.html  Enough information in fact to fill an entire semester!  Two resources that really grabbed my attention include the ChemSense animation software at http://chemsense.sri.com/download/and the Analyzing Digital Image software at http://www.umassk12.net/adi/

But the real star of this project are these UV sensitive beads.  They can be purchased online.  Here is a pic showing before/after exposure to UV light

UV beads

http://www.arborsci.com/uv-beads-package-of-1000?gclid=CPfUhOKD68kCFZEXHwodDk4Kiw

I expect to spend about 2 weeks in the classroom using Sunscreen and UV light as context for teaching first year chemistry.  Below you will find a somewhat detailed lesson plan.

Goal: The goal of this project is create a rich context for learning that engages students in an authentic research task that is relevant to public health as well Earth’s ecology and environmental sustainability.

Rationale: Secondary science education in the past has tended to emphasize content knowledge (“standards”) with little attention given to context—the questions, problems, and issues that make scientific knowledge and skills relevant to the real world and meaningful to students. This investigation will afford students the opportunity to learn numerous content objectives while also gaining insight into the methods and skills of the scientist in the broad context of links between human health and exposure to ultraviolet radiation.

Objectives:
1) Students will gain experience working in collaborative teams by performing a guided inquiry experiment.
2) Students will quantify the UV blocking capacity of various materials based on a color change using UV sensitive beads and “Analyzing Digital Image” (ADI) software.
3) Students will use experimental data to support their claims as to how different wavelengths of light energy interact with different types of matter.
4) Students will interpret and communicate the results of their research in a written report and an oral presentation.
5) Students will be able to describe and explain, using graphical representations and models, a) the electromagnetic spectrum, b) the ecological interaction of ozone in the stratosphere, and c) how particle size and atomic/molecular structure determines whether electromagnetic energy of a given wavelength (frequency) will be transmitted, absorbed, or scattered by the material.

Next Generation Science Standards:
• HS-PS2-6. Communicate scientific and technical information about why the molecular-level structure is important in the functioning of designed material.
• HS-PS4-3. Evaluate the claims, evidence, and reasoning behind the idea that electromagnetic radiation can be described either by a wave model or a particle model, and that for some situations one model is more useful than the other.
• HS-PS4-4. Evaluate the validity and reliability of claims in published materials of the effects that different frequencies of electromagnetic radiation have when absorbed by matter.
• HS-ESS3-6. Use a computational representation to illustrate the relationships among Earth systems and how those relationships are being modified due to human activity.
• Science and Engineering Practice 3 Planning and Carrying Out investigations.
• Science and Engineering Practice 4 Analyzing and Interpreting Data.
• Science and Engineering Practice 7 Engaging in Argument from Evidence.
Instructional Strategies:
• Internet Research—Students will research background information on the links between human health and exposure to the sun’s radiant energy, particularly UV energy. They will write a brief background statement (5 paragraphs and at least 2 supporting figures containing some type of data). The final draft background statement will be submitted as an introduction to a full lab report.
• Direct Instruction—The instructor will present additional information on the topic to fill in any gaps in basic knowledge, answer questions, and provide an overview of the materials and methods to be used in research. (PowerPoint: Sun Protection Understanding the Danger)
• Guided Inquiry—Students will be provided with the question to be addressed, materials and methods.
• Cooperative Learning—Students will work in small groups adopting the role of either a) project manager, b) equipment technician, b) data manager.
• Presentation—Research teams will present a poster summary of their results in class. Each team member will have a specific role during their presentation, as follows:
? Project manager will provide a summary of the overall purpose, methods, and research conclusions.
? Equipment manager will explain the function of the research equipment utilized during the project.
? Data Manager will explain the tables, graphs and other graphic representations of data.

Materials:
• UV Lamps
• UV sensitive beads
• Acetate film
• A variety of sunscreens (some containing nanoparticles), tanning lotions, fabrics, lenses, and transparent or semitransparent materials.
• ADI Software
• Digital Camera

Resources:

• ADI Software: http://www.umassk12.net/adi/
• Educational Innovations http://www.teachersource.com/ (for purchase of UV beads, UV lamps)
• Nanosense activities Clear Sunscreen: How Light Interacts with Matter web resources available at: http://nanosense.sri.com/activities/clearsunscreen/index.html

Activities
• Student Research (2 class periods; a draft background statement will be due on day four).
• Student preliminary presentations (1 class period)
• Instructor Presentation/Project Overview (1 class period)
• Preparation of a standard reference scale using ADI software and UV beads (1 class period). (UV beads will be exposed to UV light and photographed at 1 second intervals from no exposure to fully exposed).
• Data Collection (1 class periods). Most likely monitor ozone in the vicinity of the morning bus drop offs.
• Data Analysis using ADI software (1 class period).
• Report Write Up and Oral Presentations (4 class periods).
• Assignments: Text based readings with practice questions covering a) the electromagnetic spectrum, b) atomic/molecular structure and quantized energy interactions, and c) nano-particles why size matters.

Extension:
• The investigation may be performed qualitatively based on ranking the visible color change using a reference scale (photographs of UV beads at varying degrees of exposure). This approach has the advantage of simplifying the research methods, allowing students to focus on essential concepts. It also cuts the total time commitment by roughly half.
• As an extension, the project may be performed quantitatively by analyzing pictures of experimental results and comparing to the reference scale photographs using ADI software.
• Special Education: Specific to the needs of individuals based on IEP accommodations. Research teams will be chosen to maximize diversity within student groups. Project managers will be responsible for helping to assist other team members, as needed on a case by case basis.

Assessment:
• Individual lab reports including background research.
• Oral Presentations.
• Test (multiple choice and open response).


Field Testing for Ground Level Ozone

Below I’ve included an outline for a guided inquiry research project I have plans to implement this spring.  If the pilot project goes well this spring, then I would expect to carry on across multiple years with different groups of students.  I’ve attached a pdf which provides valuable background as well as detailed procedural details for making Schoenbein Paper, an ozone indicator. field_testing_for_ozone

Field Testing for Ground Level Ozone
Goal: The goal of this project is create a rich context for learning that focuses on an authentic research task that is relevant to public health as well Earth’s ecology and environmental sustainability.

Rationale: The goals of this inquiry project are to foster enthusiasm for learning chemistry, the scientific method and experimental design, gain competency at working in teams, and to develop oral and written communication skills. The investigation should be performed during periods of peak ozone production, which occur during hot, humid atmospheric conditions (September and June for most schools). Late autumn and early spring conditions may also be monitored as base line data when ozone concentration can be expected to be lower.

Objectives:
1) Students will gain experience working in collaborative teams by performing a guided inquiry experiment.
2) Students will quantify ground level ozone concentration based on a color change using Schoenbein Paper and “Analyzing Digital Image” (ADI) software.
3) Students will be able to interpret chemical equations and explain how the interaction of light and matter may be used to quantify chemical change.
4) Students will interpret and communicate the results of their research in a written report and an oral presentation.
5) Students will be able to describe and explain, using graphical representations and models, a) the basic structure of Earth’s atmosphere, b) the ecological interaction of ozone in the troposphere and stratosphere, c) the chemistry of ozone production including concepts such as catalysis, d) the risks and physiological effects of exposure to ozone, and e) how natural and anthropogenic factors control the ozone concentration as well as how it is affected by chemicals released into the atmosphere.

Next Generation Science Standards:
• HS-PS1-5 Apply scientific principles and evidence to provide an explanation about the effects of changing the temperature or concentration of the reacting particles on the rate at which a reaction occurs.
• HS-PS1-6 Refine the design of a chemical system by specifying a change in conditions that would produce increased amounts of products at equilibrium.
• HS-PS4-5 Communicate technical information about how some technological devices use the principles of wave behavior and wave interactions with matter to transmit and capture information and energy.
• Science and Engineering Practice 3 Planning and Carrying Out investigations.
• Science and Engineering Practice 4 Analyzing and Interpreting Data.
• Science and Engineering Practice 7 Engaging in Argument from Evidence.
Instructional Strategies:
• Internet Research—Students will research background information on tropospheric and stratospheric ozone. They will write a brief background statement (5 paragraphs and at least 2 supporting figures containing some type of data). The final draft background statement will be submitted as an introduction to a full lab report.
• Direct Instruction—The instructor will present additional information on the topic to fill in any gaps in basic knowledge, answer questions, and provide an overview of the materials and methods to be used in research.
• Guided Inquiry—Students will be provided with the question to be addressed, materials and methods.
• Cooperative Learning—Students will work in small groups adopting the role of either a) project manager, b) equipment technician, b) data manager.
• Presentation—Research teams will present a poster summary of their results in class as well as a larger science symposium open to the general public.
Materials:
• Potassium Iodide
• Starch
• Filter paper
• ADI Software
• Digital Camera
• High Wattage lamp (optional)
• Ozone Generator (optional)
• Ozone monitor (optional)
• Wet/dry bulb psychrometer (optional)

Resources:
• US EPA Air Quality Workshop “Field Testing Ground Level Ozone” A full explanation of research methods is provided here: field_testing_for_ozone or on the web at:
http://www.epa.gov/airnow/workshop_teachers/field_testing_for_ozone.pdf
• ADI Software: http://www.umassk12.net/adi/
• Ozone Solutions, Inc. http://www.ozonesolutions.com/

Activities
• Student Research (2 class periods; a draft background statement will be due on day four).
• Student preliminary presentations (1 class period)
• Instructor Presentation/Project Overview (2 class periods)
• Preparation of test paper and standard test samples (optional; 2 class periods, requires ozone monitor and ozone generator).
• Data Collection (2 class periods). Most likely monitor ozone in the vicinity of the morning bus drop offs.
• Data Analysis using ADI software (2 class periods).
• Report Write Up and Oral Presentations (4 class periods).
• Assignments: Text based readings with practice questions covering a) the scientific method; b) light as electromagnetic waves; c) chemical reactions; and d) catalysis.

Extension:
• The project may be performed qualitatively based on ranking the visible color change using a Schoenbein reference scale (available online). This approach has the advantage of simplifying the research methods, allowing students to focus on essential concepts. It also cuts the total time commitment by roughly half.
• As an extension, the project may be performed quantitatively by creating a set of known standards using an ozone generator and monitor.
• Either approach may be explored using ADI software, available as a free download.

Special Education: Specific to the needs of individuals based on IEP accommodations. Research teams will be chosen to maximize diversity within student groups. Project managers will be responsible for helping to assist other team members, as needed on a case by case basis.

Assessment:
• Individual lab reports including background research.
• Oral Presentations.
• Test (multiple choice and open response).

Simple Anaerobic Digester for Classroom Demonstration or Projects

For anyone interested in attempting to generate biogas (methane) as a class demonstration or student project, I’ve attached a powerpoint (Biofuels teaching energy in life science) developed for my sustainable energy course, which I also used to present at a town fair when I taught in Vermont. The organic waste remains contained, so odors were not a problem.  Also, no known pathogens can grow in the anaerobic environment of the sealed digester, so health risks are quite low.  Use proper precautions as one would in any lab environment (gloves, lab apron, safety glasses) when loading and unloading the digester.  In fact, this technology is used on farms, with one of many benefits being the treated fibrous waste can be used as bedding for farm animals.  Studies have demonstrated that this type of livestock bedding actually reduces infections among the livestock, compared to the use of sand or sawdust as is typical.  Pretty amazing!

The very last slide shows a pic of the design I had the most success with.  I’ll insert it here for convenience:

digester

I used a 5gal Poland spring water bottle.  Only drawback is its difficult to fill and even more so to empty. (A food grade 5 gallon bucket with lid might be an improvement.)  I used goat droppings as my source of methanogenic bacteria because the goat pellets can pass through a large funnel during filling.  I also added quick oats as a source of carbon and nitrogen to feed the microbes (you want a high C/N ratio, which is why human waste streams in the USA can pose problems, as we Americans eat a lot of protein).  Ideally the system should be stirred constantly, but I had success by shaking the bottle three time/day.  A Mylar balloon is impermeable to the CO2/CH4 gas mixture so its ideal as a gas collection vessel.  Rather than attach the filled balloon to a bunsen burner, I would attach the balloon via tygon tubing to a glass pasteur pipette.  Its small opening would allow for a small, pencil tipped size flame, so one full ballon would last all day to demonstrate to all my classes.

These simple, desktop scale classroom systems generally do fail after a few days as the pH  drops below 7.  This is because acid producing bacteria grow much more rapidly than the methanogens.  Ironically acetic acid is the “preferred food” of most methanogenic bacteria, but they are also very sensitive to pH.  So as their food supply becomes overabundant, pH drops, and the population collapses.

This is why its best to start with a lot of manure and relatively less oatmeal.  Thus encouraging a large population of methanogens relative to the acid producing bacteria.  Also, larger volume bioreactors are generally more stable over time than smaller reactors.  I have not had very good luck with buckets smaller than 5 gallons.

A big water bath heated with an aquarium heater works to maintain the constant ~98F temp for “mesophyllic” methanogenic bacteria (the type that live in the gut of a cow, horse, or goat.   However, thermophyllic (higher temp) digesters have been used successfully to treat hospital waste, with the added benefit that the higher temperatures not only drastically reduces the total amount of biomass needed for eventual disposal, but is even more effective at sanitizing the final waste product.  The mesophyllic digesters are more commonly used due to lower cost (less energy needed to maintain mesophyllic temperatures), for sewage treatment (example: Deer Island, Boston) and livestock operations.  Its still a very much underutilized technology hear in the USA.

Lesson Overview of New High School Analysis of Computer Energy Use

Here is the lesson overview for a whole class open inquiry project completed in 2015 following completion of a new high school construction project.  We used the building as a learning laboratory, which helped our school earn points toward green building certification (LEED–Leadership in Energy and Environmental Design).  A copy of the final project and summary of our results appear in the previous post.

Essential Question:

What opportunities exist in the new Greenfield High School to reduce electric power consumption, which will result in cost savings and decreased greenhouse gas emissions?

Standards:

SCI.9-12.E.II.SIS2.5.a – making observations

SCI.9-12.E.II.SIS2.5.c – collecting data or evidence in an organized way

SCI.9-12.E.II.SIS2.6 – [Learning Standard] – Properly use instruments, equipment, and materials (e.g., scales, probeware, meter sticks, microscopes, computers) including set-up, calibration (if required), technique, maintenance, and storage.

SCI.9-12.E.II.SIS3.5 – [Learning Standard] – Present relationships between and among variables in appropriate forms.

SCI.9-12.E.II.SIS3.5.a – Represent data and relationships between variables in charts and graphs.

SCI.9-12.E.II.SIS3.5.b – Use appropriate technology (such as graphing software, etc.) and other tools.

SCI.9-12.E.II.SIS3.1 – [Learning Standard] – Use mathematical operations to analyze and interpret data results.

SCI.9-12.E.III.9.2 – [Learning Standard] – Use appropriate metric/standard international (SI) units of measurement. (KWH)

SCI.9-12.E.III.1 – [Learning Standard] – Construct and use tables and graphs to interpret data sets.

SCI.9-12.E.III.2 – [Learning Standard] – Solve algebraic expressions.

 Overview of Lesson Plan Objectives:

This is a multi-day whole class project designed to provide students with an authentic experience in applied building science. Student’s will identify a problem associated with school energy consumption, develop a plan to document power consumption using data loggers, organize and analyze data in tables and graphs, and project energy and cost savings using mathematical methods such as dimensional analysis. The results of their project will be presented to the superintendent of schools, as well as the general public at the school’s spring open house. The results of this project will also be submitted for review toward earning points in the LEED for new construction certification process. LEED, or Leadership in Energy & Environmental Design, is a green building certification program that recognizes best-in-class building strategies and practices. To receive LEED certification, building projects satisfy prerequisites and earn points to achieve different levels of certification. “Using the building as a learning tool” qualifies for LEED accreditation points.

 Activities:

  1. Initial building walkthrough to identify sources of electric power consumption and opportunities for data collection and potential savings.
  2. Data collection using appropriate tools (Watts-Up! Professional Power meters).
  3. Data Analysis, calculations, and organization using excel spreadsheets.
  4. Poster presentation at school open house. Summary of results and recommendations mailed to Greenfield Public School’s central office.

Materials needed and other supporting resources:

  • Watts Up-Pro Data Loggers (x6)
  • Text: “Residential Energy Efficiency–cost savings and comfort for existing buildings” by John Krigger and Chris Dorsi.
  • Microsoft Excel
  • Microsoft Publisher

 Assessment (Summative):Each student working alone or as a group of two will be responsible for the analysis, calculations, and organization of data associated with power consumption from some aspect of the new Greenfield High School Building (The initial building walk though resulted in the identification of computer energy use as the project focus. Since the students played a direct role in problem identification, the project meets the definition of Open Inquiry, the central practice of the scientist.)

Rubrics:

21st Century Learning Expectations

  • A2 Think critically and effectively to solve problems
  • A4 Use relevent technology
  • C10 Engaged citizens

Point system grading:

Data Graphs:

Title—1 point

Axis labels—2 points

Appropriate scale on axes—2 points

Presentation of data—3 points

Data Tables and Calculations:

Calculations including Dimensional Analysis: 24 points

Total points 32 points

New High School Analysis of Computer Energy Use

Energy and Cost Savings From Computers at the New GHS

I’ve attached a project completed by my Sustainable Energy Class, which investigated energy use by computers in our newly constructed high school building.  This project provided an authentic experience for my students, who made great strides in improving their math, science, technology, and team work skills.   A key result of this project is that we were able to identify an opportunity to save the school a few thousand dollars per year.  See the attachment for all the details.

While not included in the attached project, we were also able to use natural gas usage data to compare the energy densities of the new and old high schools (using 2014 data from the old school).  Based on that data, the old building’s energy density was 13.1 BTU/Ft2-HDD, whereas the new building’s energy density was 11.5 BTU/Ft2-HDD.    In short, the smaller number for the new building indicates greater energy efficiency.

To make a valid comparison, we divided total energy consumption for each building by its area in square-feet, which corrects for the different sizes of the two buildings.  We also divided by the number of heating degree days (HDD), which corrects for differences in weather.  Heating degree days are defined as the difference between the average temperature experienced on a given day, and a set point temperature where no heating is needed (the set point is usually set at 65°F).  For example, if average temperature on a given day was 55°F, then 10 HDD’s accrued on that day.

The new high school experienced 1416.5 HDD in 2015 and the old building experienced 1277.5 HDD in 2014.  The larger number here indicates a colder winter on average.

Old Greenfield High School Lighting Analysis

Here is an attachment to a student “energy audit” performed on our old high school back in 2010.  A new school is under construction, however much of the new building is complete and in fact the majority of academic classes, adminsitration, library, computer labs, and guidance are fully operational.  The new science classrooms, cafeteria, gym, and auditorium won’t be complete until the 2015/2016 school year.  In any case, my Sustainable Energy class is in the process of completing an  “energy audit” on this new building, which will be LEED certified (a green building standard).   I’ll be posting the results of that study in a few weeks, with much of our focus on computer energy use.  Stay tuned! GHS_Lighting_Analysis