what is the problem with the integration below? (the peak group at 8.0-8.5ppm is integrated vs. other peaks to calculate copolymer composition.)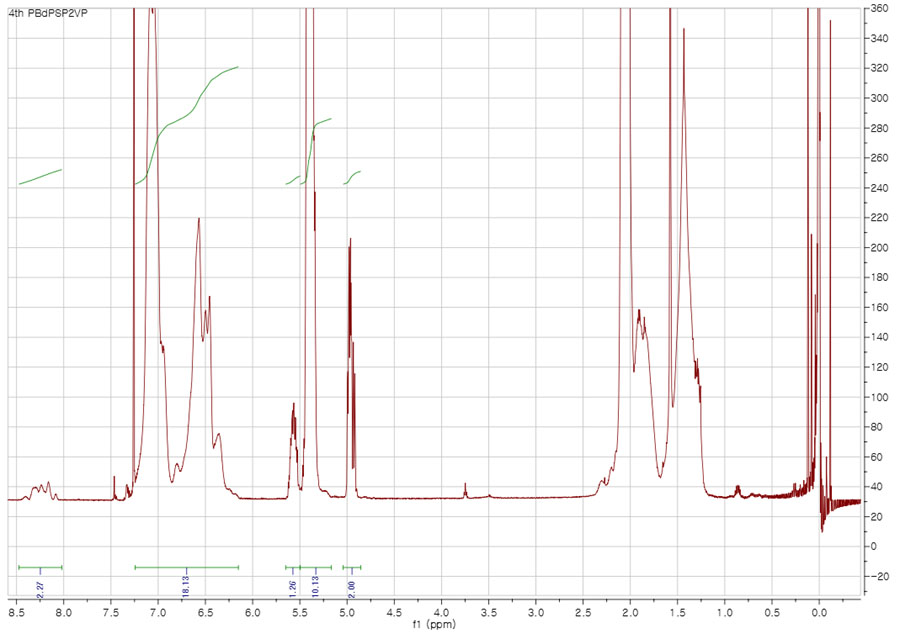
what is the problem with the integration below? (the peak group at 8.0-8.5ppm is integrated vs. other peaks to calculate copolymer composition.)
Users need to order a rotor (container for your sample) from Bruker online store. The part number is B200147 (4 mm rotor with 3 Kel-F caps). It is kind of expensive but it can be used many times.
The rotor spins at very high speed (usually >=4khz) during experiments. The acceleration can reach several thousand g. No liquid is allowed in the rotor as it will be squeezed out during spinning. This would contaminate the probe and cause arcing, and make the spinning difficult. A poorly spinning rotor could explode inside the probe and incur thousands of dollars of repairs.
Related link: How to minimize DOSY artifacts due to convection
1. In Topspin, go to Help -> Manuals, find “DOSY” handout. Read and understand the principle.
2. rsh shim.best; lock; topshim; collect a standard proton spectrum (atma; rga; zg); calibrate 90deg pulse.
3. In edc window, click Experiment. in “…/user” directory, choose experiment DIFFUSION1D. check getprosol box.
3a. After you have created the new file, update p1 with the value that you have just obtained in step 2.
4. Run a spectrum. This one is with gpz6 = 2 (default; means 2% of the gradient amp power is used).
5. Create a new experiment by edc and choose “Use current parameters“. If your getprosol box is automatically checked, please uncheck it (if you don’t do this, the new file will use the spectrometer default pulsing parameters instead of the ones that you have just calibrated). Don’t do rga. type gpz6 and enter 95 (give the gradient amp 95% of the power). run the experiment.
5a. If the tall and sharp peaks have negative spikes on their sides that cannot be fixed by phase correction, type loopadj, then rerun the experiments.
6. compare the two spectra with 2% and 95% gradient powers (you can use the Multiple Display function to do this). You usually need the latter to be about or less than 1% of the former to obtain an accurate diffusion coefficient (D). You will need to adjust d20 to achieve this. d20 could range from 0.02 s to 0.5 s. The longer the d20, the deeper is the decay. Every time you change d20, you need to rerun both experiments.
6a. If your target peak cannot achieve this much decay within this window of d20, you will need to adjust another parameter, p30. p30 is the length of the gradient pulse and you will need to be extra careful as an erroneous value could burn the gradient amplifier and damage the probe, resulting in several thousand dollars of repair cost. The default p30 is 1000 us (microseconds). The maximum p30 that you can use is 2500 us. The default unit of p30 is us, so if you input 2500, the instrument will interpret it as 2500 us.
7. Once an optimal d20 (and optionally p30) is decided, create another new file by choosing DIFFUSION2D. change d20, p30, and p1 to the values that you have determined. Enter a suitable NS (should be multiple of 16). enter command dosy 2 95 16 q y y. This is a macro that will run a 2D DOSY expt. Meaning of the parameters: 2: beginning gradient amplitude = 2%; 95: ending gradient amplitude = 95%; 16: number of 1d slices = 16; q: increment is square rooted (alternatively, you could do l for linear increment); the first y: begin acquisition; the second y: do a rga before the run. For more details, please read the Bruker brochure mentioned in step 1. Note: if your target peak is overlapping with a large solvent peak, you could set the beginning gradient amplitude to be higher than 2%, say, e.g., 10%. This will greatly suppress the solvent peak intensity for your first data point and thus improve the quality of this point.
8. When done, click ProcPars tab and change SI of F1 column to 32. In command line, type xf2 to Fourier transform (only in the 2nd dimension). Correct phase. Only phase-correct rows. Then correct baseline.
9. type setdiffparm. This sends the experimental parameters that you used to Dynamics Center for data fitting.
10. on main menu, click Analysis -> T1/T2 module -> Dynamics Center. Or just type dync. Follow the flow in the new window. Instruction on using Dynamics Center can be found here.
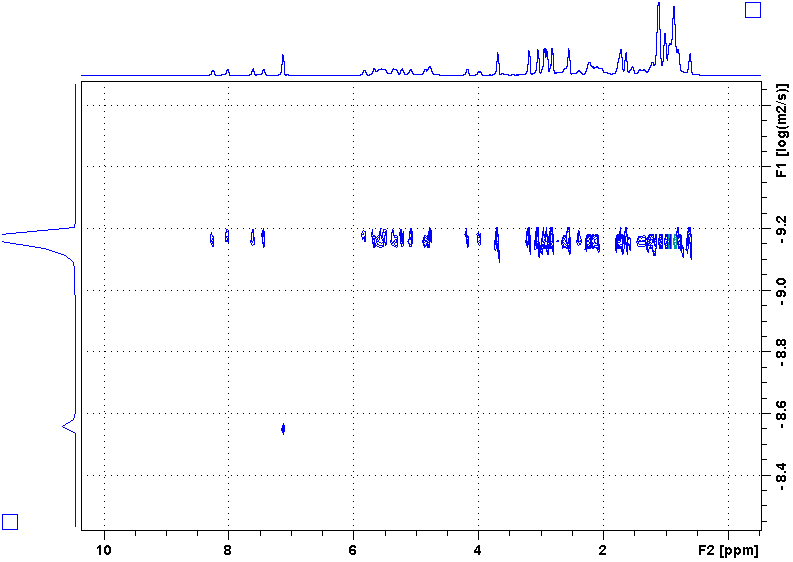
Following is a DOSY spectrum of cyclosoprin-A in benzene-d6. Most peaks are in the upper row while there is only one peak in the lower row. Why?
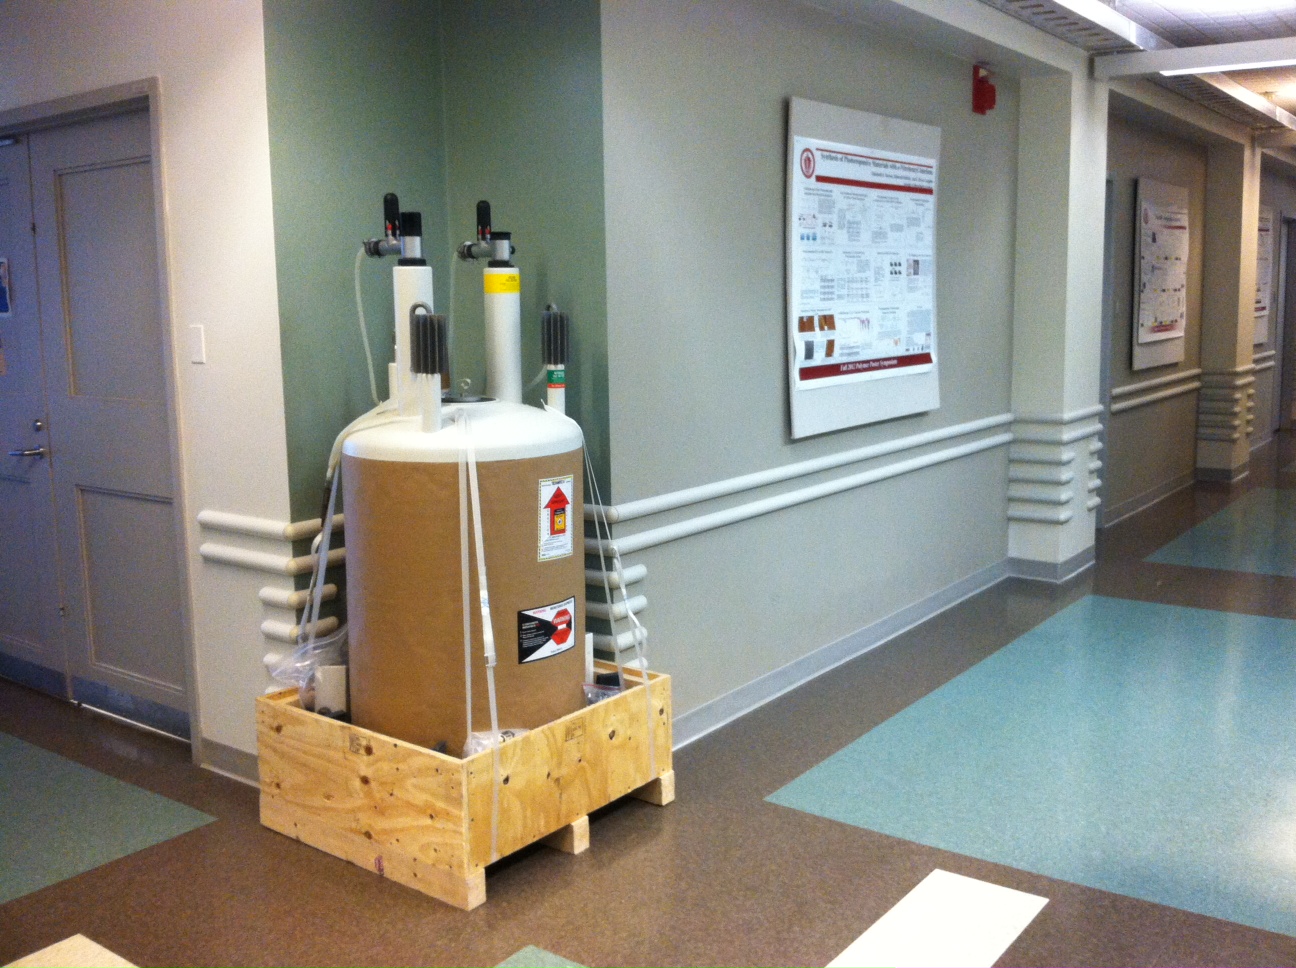
These pictures were taken right before Christmas of 2014:
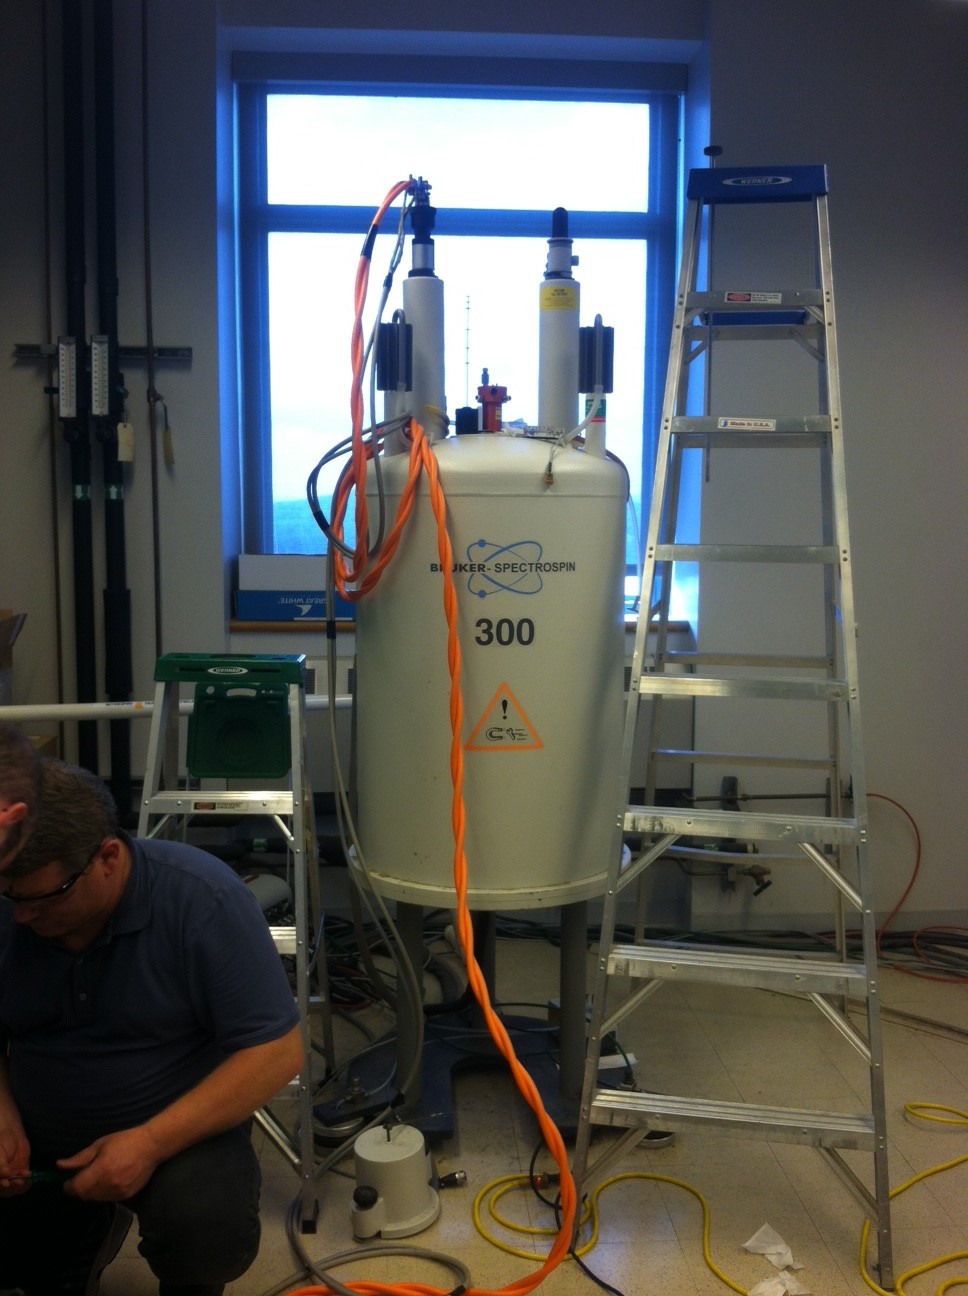
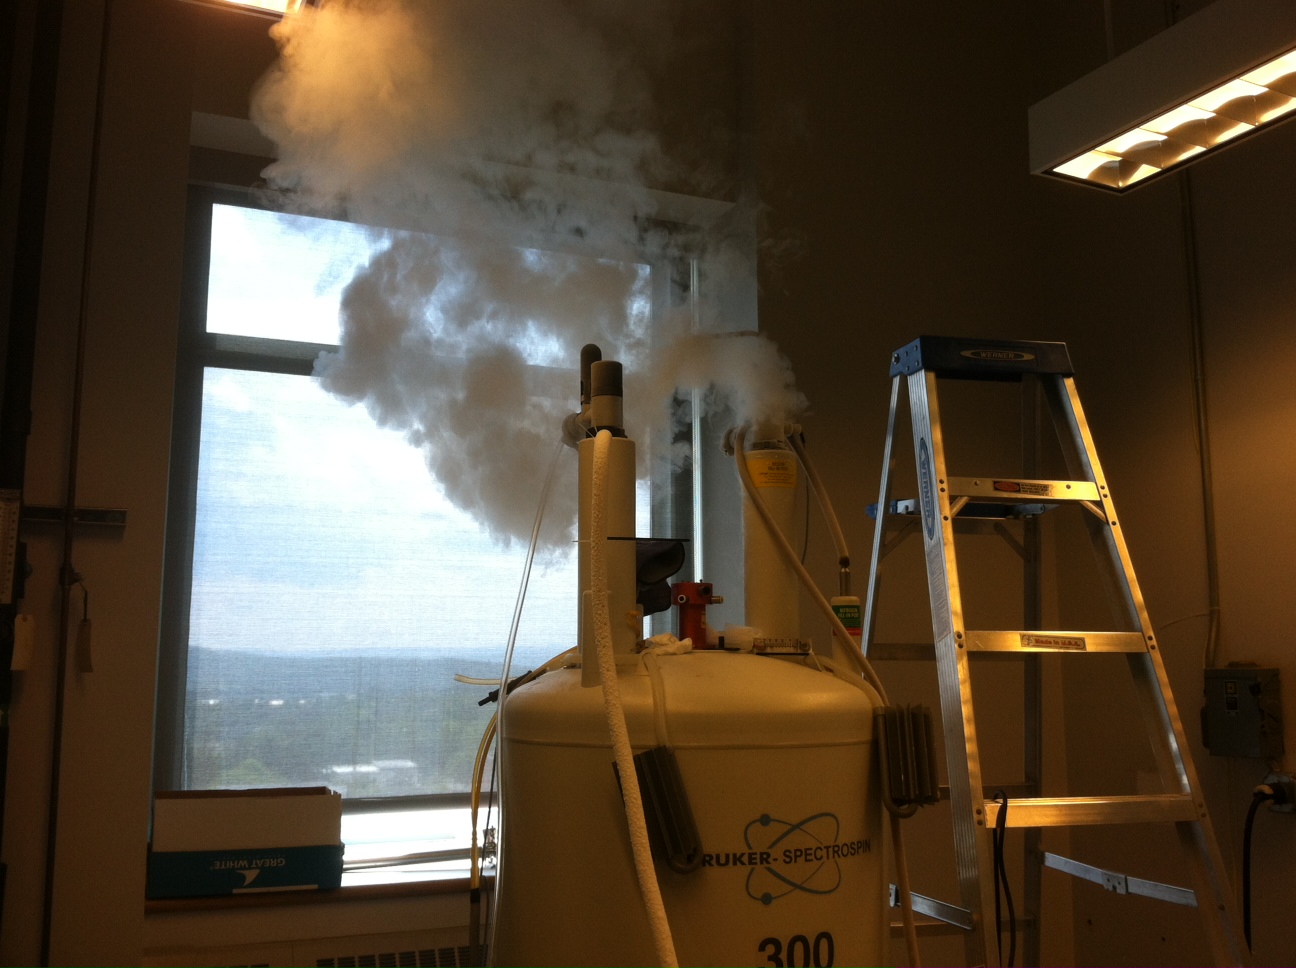
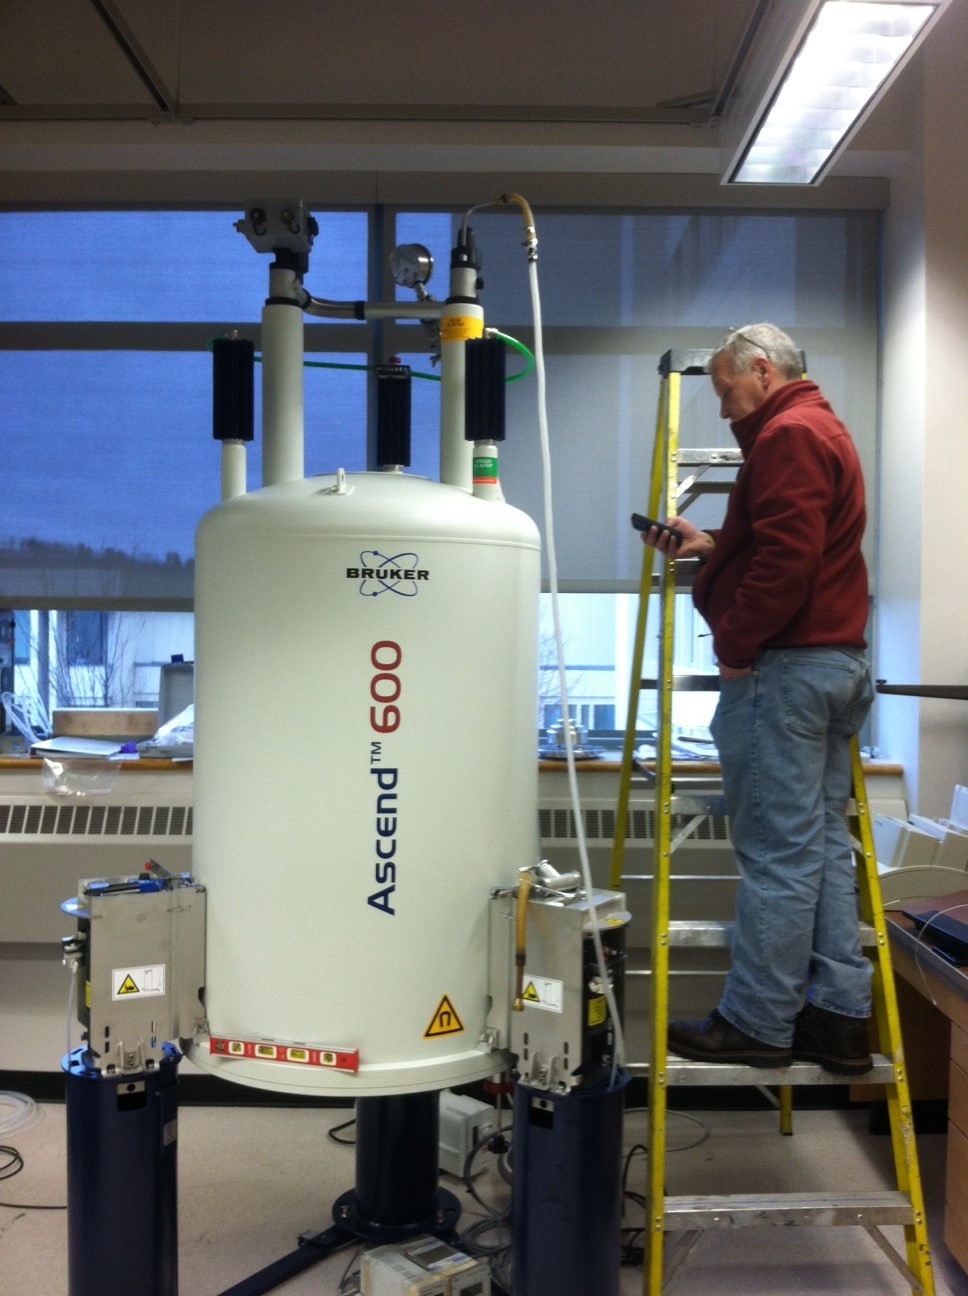 Helium dewar in the magnet is being cooled down by cold nitrogen gas. Then liquid helium will take over to further cool the dewar to 4K.
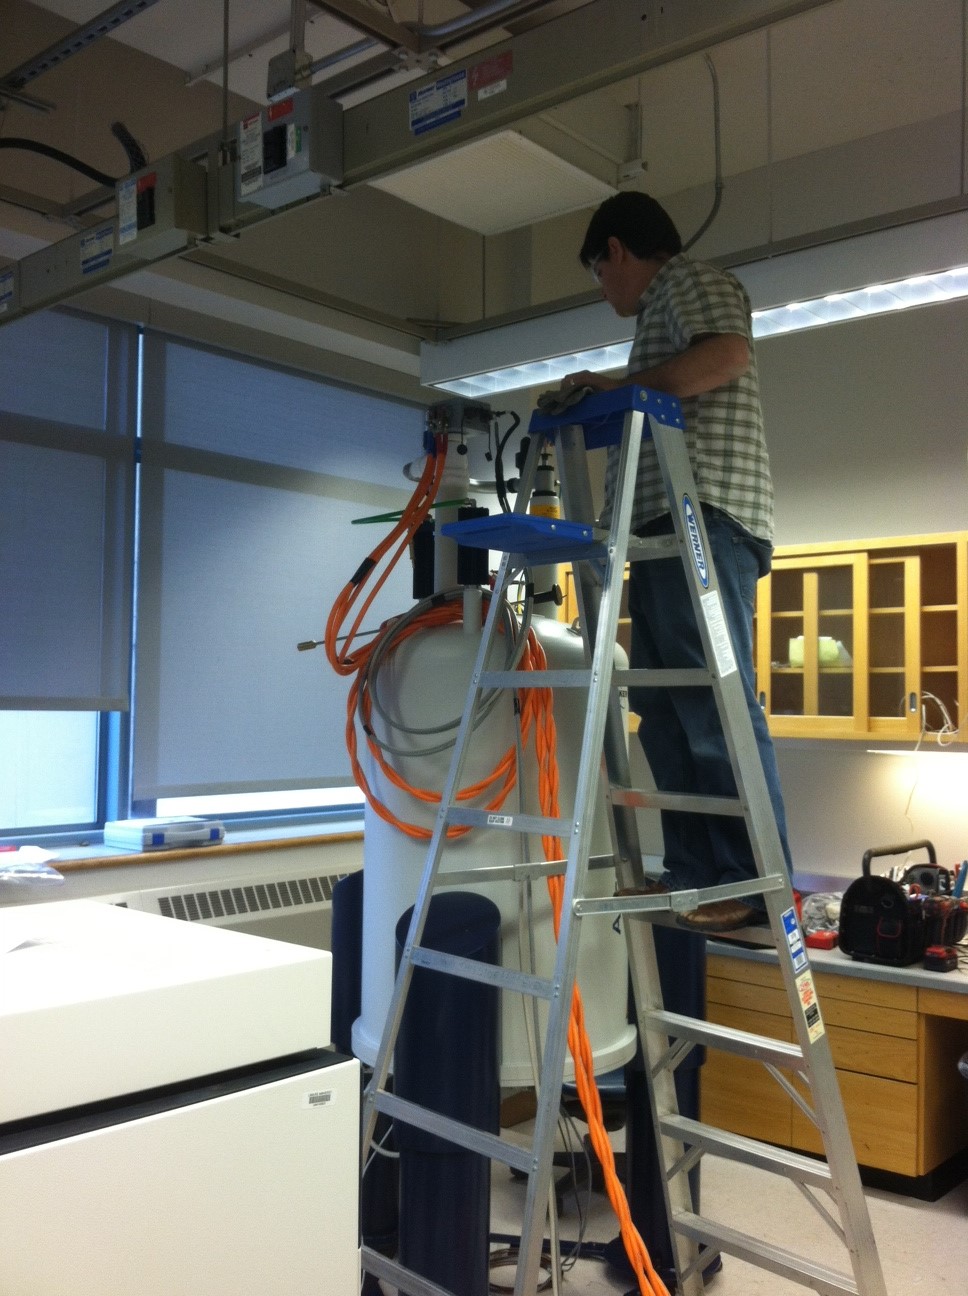 Current is flowing via the orange cable to the superconducting coil. The big rock is gradually becoming magnetic.
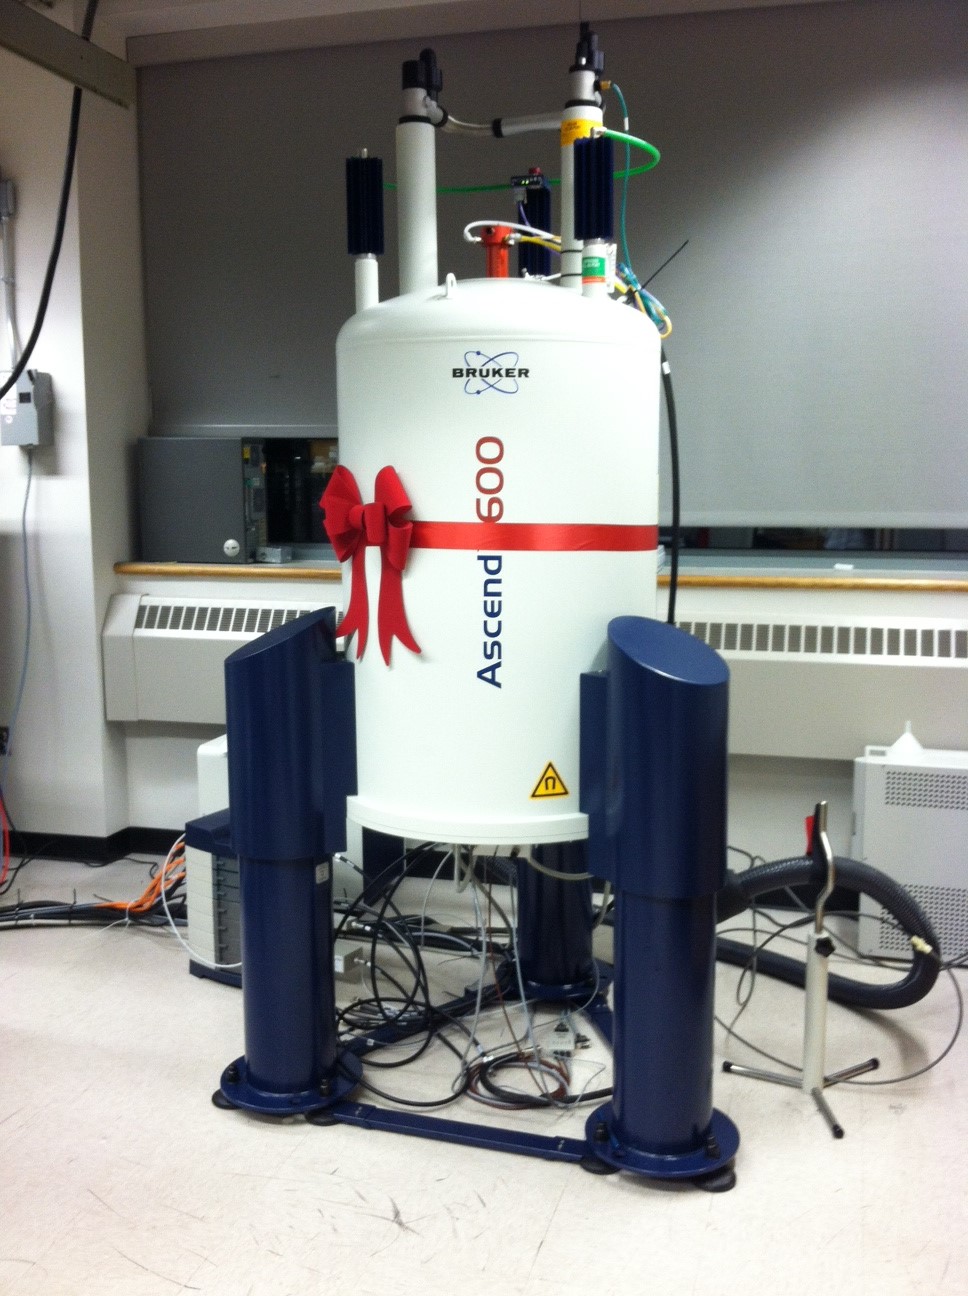 What a big Christmas gift!
Following is a 31P kinetics spectrum run on the 500, collected by Zak Page. Over the course of the reaction, the decrease of the reactant peaks at 28 ppm, the increase of the product peaks at 1 ppm, and the first increase, then decrease of the intermediate signal at 27 ppm can be clearly seen. The time scale of the F1 dimension is erroneous (a software glitch).

Please carefully read all the content of this file before you begin your 400 and 500 journey:
Yael Balazs, a UMass Chemistry Alumina and currently NMR Director at Technion – Israel Institute of Technology, authored a series of nice NMR training video:
http://www.youtube.com/channel/UCZlxixehE9JONeGTVqMjEjw
Please enjoy!

(1) Arrived! … in pieces.

(2) magnet is lifted and assembled.

(3) Cloud… formed by cold helium gas. Quenched when ramping up the field.

(4) Succeeded on the second try. The curve on the screen is the first NMR spectrum from our new 500. It does not resemble anything like our typical NMR spectra though? – Engineers will still need to do cryo-shim and room-T shim to make the peak sharper (about 10,000 times sharper than what’s on the screen).
7/31/14. The soul (a.k.a. superconducting current) is leaving the magnet via the orange wires.
7/31/14. Left-over liquid helium and nitrogen are being driven out.
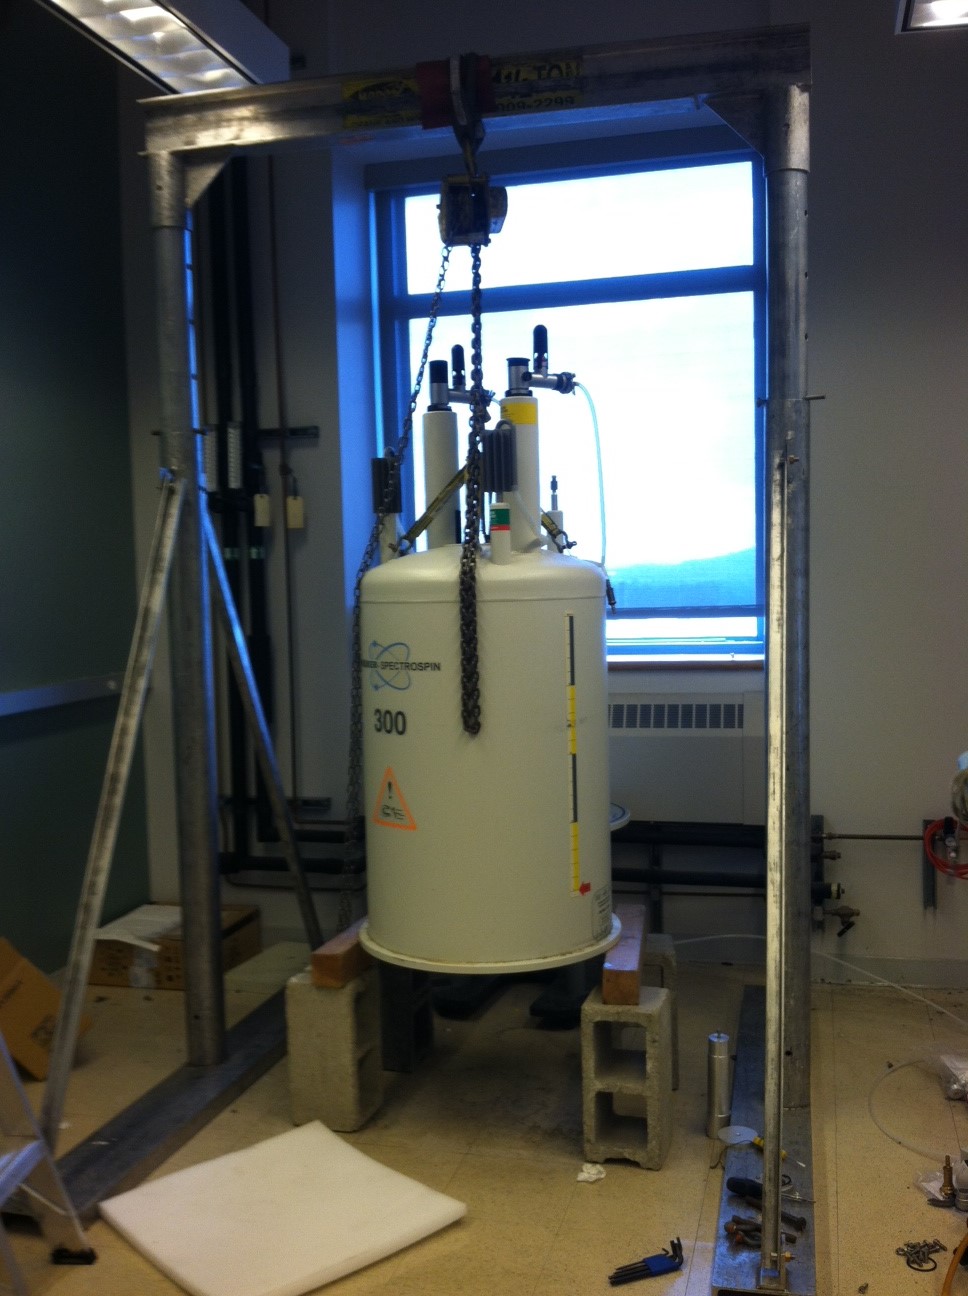
8/4/14. Magnet is being lifted (and legs off).
8/6/14. Sitting quietly in a corner, ready for its next journey.
It is possible to run NMR experiments with non-deuterated solvents. It will have to be run in an unlocked state. Follow these steps: