Related link: How to minimize DOSY artifacts due to convection
1. In Topspin, go to Help -> Manuals, find “DOSY” handout. Read and understand the principle.
2. rsh shim.best; lock; topshim; collect a standard proton spectrum (atma; rga; zg); calibrate 90deg pulse.
3. In edc window, click Experiment. in “…/user” directory, choose experiment DIFFUSION1D. check getprosol box.
3a. After you have created the new file, update p1 with the value that you have just obtained in step 2.
4. Run a spectrum. This one is with gpz6 = 2 (default; means 2% of the gradient amp power is used).
5. Create a new experiment by edc and choose “Use current parameters“. If your getprosol box is automatically checked, please uncheck it (if you don’t do this, the new file will use the spectrometer default pulsing parameters instead of the ones that you have just calibrated). Don’t do rga. type gpz6 and enter 95 (give the gradient amp 95% of the power). run the experiment.
5a. If the tall and sharp peaks have negative spikes on their sides that cannot be fixed by phase correction, type loopadj, then rerun the experiments.
6. compare the two spectra with 2% and 95% gradient powers (you can use the Multiple Display function to do this). You usually need the latter to be about or less than 1% of the former to obtain an accurate diffusion coefficient (D). You will need to adjust d20 to achieve this. d20 could range from 0.02 s to 0.5 s. The longer the d20, the deeper is the decay. Every time you change d20, you need to rerun both experiments.
6a. If your target peak cannot achieve this much decay within this window of d20, you will need to adjust another parameter, p30. p30 is the length of the gradient pulse and you will need to be extra careful as an erroneous value could burn the gradient amplifier and damage the probe, resulting in several thousand dollars of repair cost. The default p30 is 1000 us (microseconds). The maximum p30 that you can use is 2500 us. The default unit of p30 is us, so if you input 2500, the instrument will interpret it as 2500 us.
7. Once an optimal d20 (and optionally p30) is decided, create another new file by choosing DIFFUSION2D. change d20, p30, and p1 to the values that you have determined. Enter a suitable NS (should be multiple of 16). enter command dosy 2 95 16 q y y. This is a macro that will run a 2D DOSY expt. Meaning of the parameters: 2: beginning gradient amplitude = 2%; 95: ending gradient amplitude = 95%; 16: number of 1d slices = 16; q: increment is square rooted (alternatively, you could do l for linear increment); the first y: begin acquisition; the second y: do a rga before the run. For more details, please read the Bruker brochure mentioned in step 1. Note: if your target peak is overlapping with a large solvent peak, you could set the beginning gradient amplitude to be higher than 2%, say, e.g., 10%. This will greatly suppress the solvent peak intensity for your first data point and thus improve the quality of this point.
8. When done, click ProcPars tab and change SI of F1 column to 32. In command line, type xf2 to Fourier transform (only in the 2nd dimension). Correct phase. Only phase-correct rows. Then correct baseline.
9. type setdiffparm. This sends the experimental parameters that you used to Dynamics Center for data fitting.
10. on main menu, click Analysis -> T1/T2 module -> Dynamics Center. Or just type dync. Follow the flow in the new window. Instruction on using Dynamics Center can be found here.
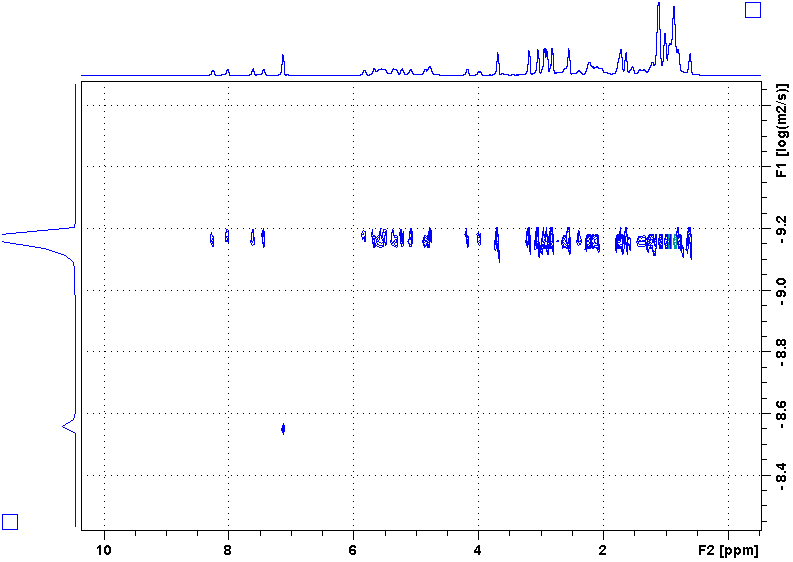
Following is a DOSY spectrum of cyclosoprin-A in benzene-d6. Most peaks are in the upper row while there is only one peak in the lower row. Why?
